Fig. A.1
Download original image
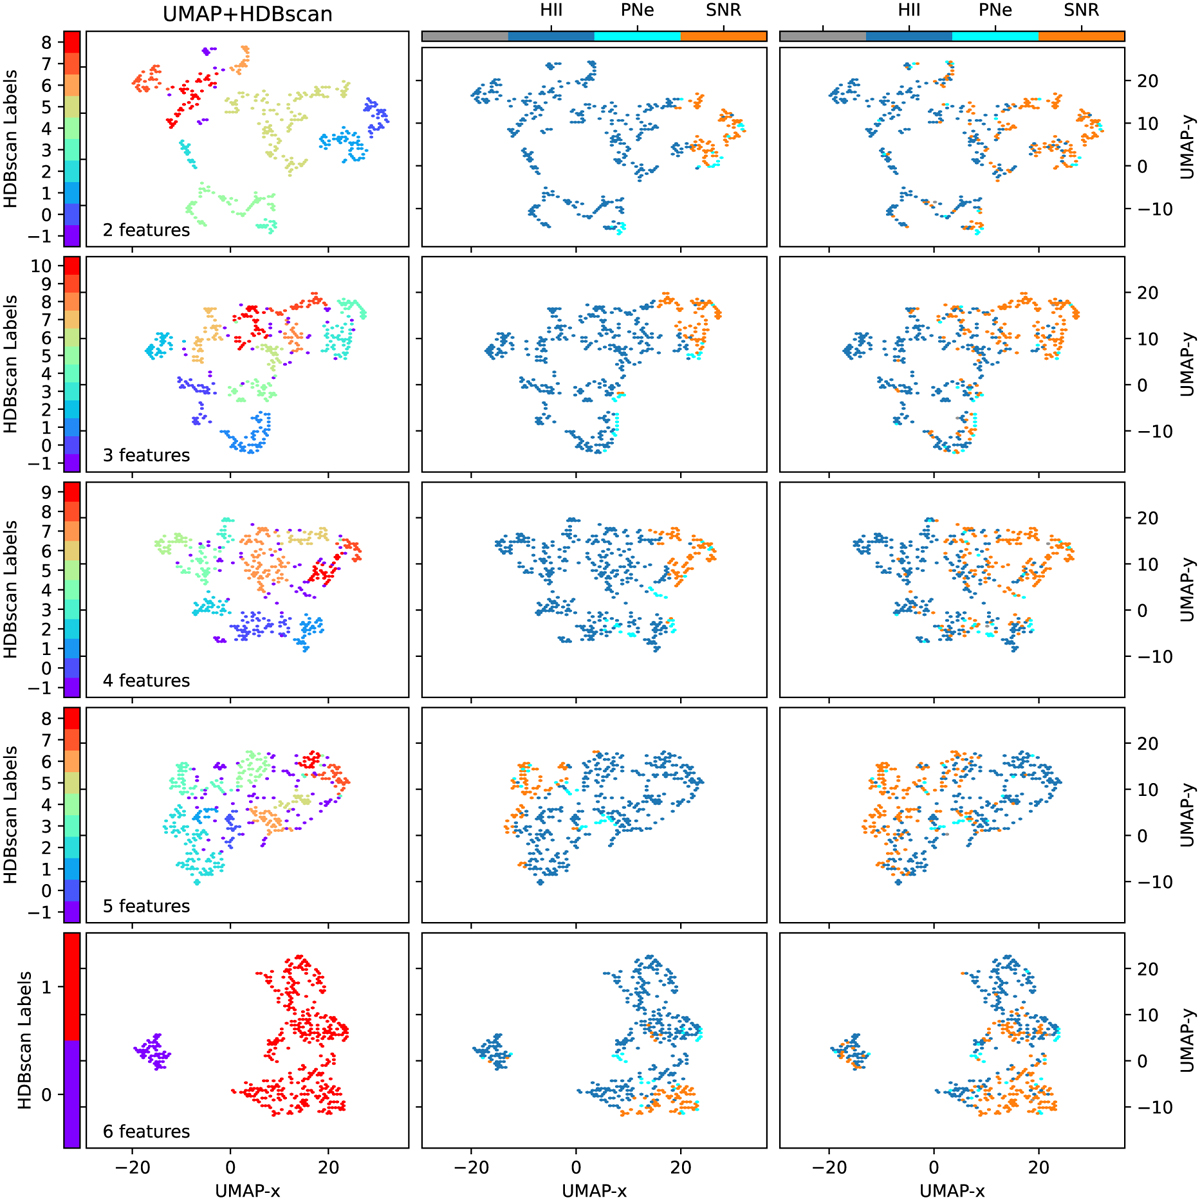
Sample classification via machine learning. (Left) UMAP 2D projection with HDBscan cluster labels. (Middle) UMAP 2D projection with [N II]λ6583-based BPT diagram labels. (Right) UMAP 2D projection with [S II]λ6716 + 31-based BPT diagram labels. The inset text shows the number of features in each run. All displayed runs are with n_neighbours= 20.
Current usage metrics show cumulative count of Article Views (full-text article views including HTML views, PDF and ePub downloads, according to the available data) and Abstracts Views on Vision4Press platform.
Data correspond to usage on the plateform after 2015. The current usage metrics is available 48-96 hours after online publication and is updated daily on week days.
Initial download of the metrics may take a while.