Fig. 18
Download original image
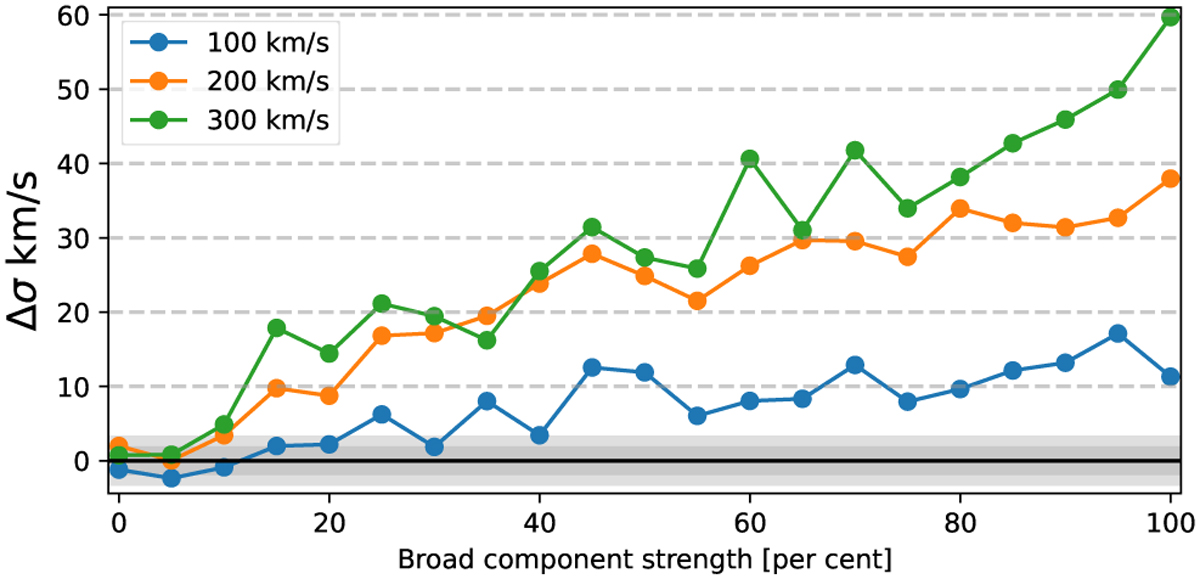
pPXF recovered velocity dispersion of composite lines and a single narrow line. The x-axis represents the per cent increase of the strength of the broad component relative to the narrow line. The gray-shaded horizontal area demarcates the average uncertainty in the DIG velocity dispersion measurement (single narrow line results).
Current usage metrics show cumulative count of Article Views (full-text article views including HTML views, PDF and ePub downloads, according to the available data) and Abstracts Views on Vision4Press platform.
Data correspond to usage on the plateform after 2015. The current usage metrics is available 48-96 hours after online publication and is updated daily on week days.
Initial download of the metrics may take a while.