Open Access
Fig. 9
Download original image
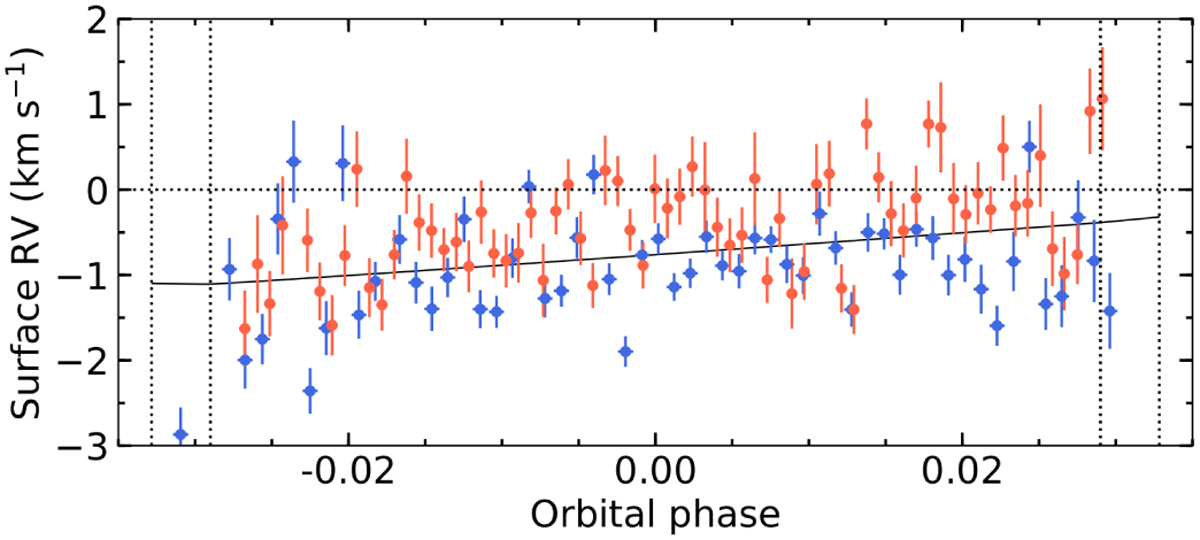
RVs of the stellar surface regions occulted by KELT-11 b during the 16-02 (blue points) and 07-03 (orange points) nights. The solid black line is the best-fit model to both nights adjusted together. The vertical dotted lines indicate transit contacts.
Current usage metrics show cumulative count of Article Views (full-text article views including HTML views, PDF and ePub downloads, according to the available data) and Abstracts Views on Vision4Press platform.
Data correspond to usage on the plateform after 2015. The current usage metrics is available 48-96 hours after online publication and is updated daily on week days.
Initial download of the metrics may take a while.