Fig. 5
Download original image
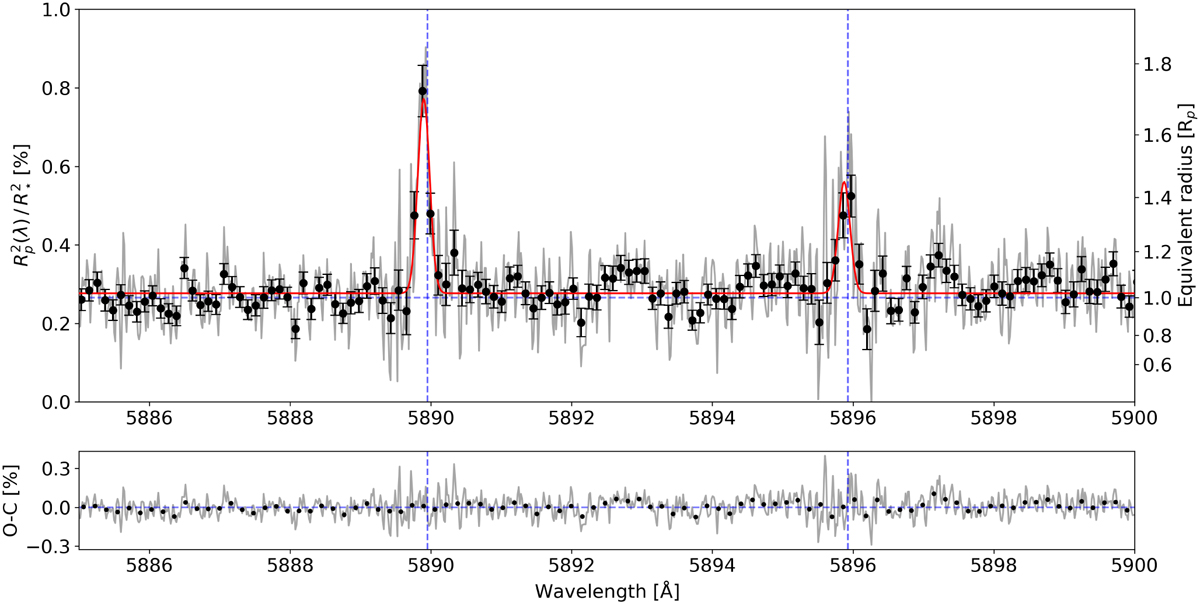
Combined transmission spectrum of KELT-11 b in the sodium doublet wavelength range, using Epoch 2 and Epoch 3 merged from HARPS observations. The vertical blue dashed lines show the planetary rest frame transition wavelength of the Na I doublet, the horizontal one is the white-light radius. Top: transmission spectrum and Gaussian fit of the lines. The gray line represents the unbinned resulting transmission spectrum. The black points show the binned spectrum with a 0.1 Å step. The red line is the Gaussian fit to the unbinned transmission spectrum. Bottom: residuals from the Gaussian fit to the transmission spectrum. The gray line represents the residuals at each wavelength and is binned in the same way as the transmission spectrum.
Current usage metrics show cumulative count of Article Views (full-text article views including HTML views, PDF and ePub downloads, according to the available data) and Abstracts Views on Vision4Press platform.
Data correspond to usage on the plateform after 2015. The current usage metrics is available 48-96 hours after online publication and is updated daily on week days.
Initial download of the metrics may take a while.