Fig. 3
Download original image
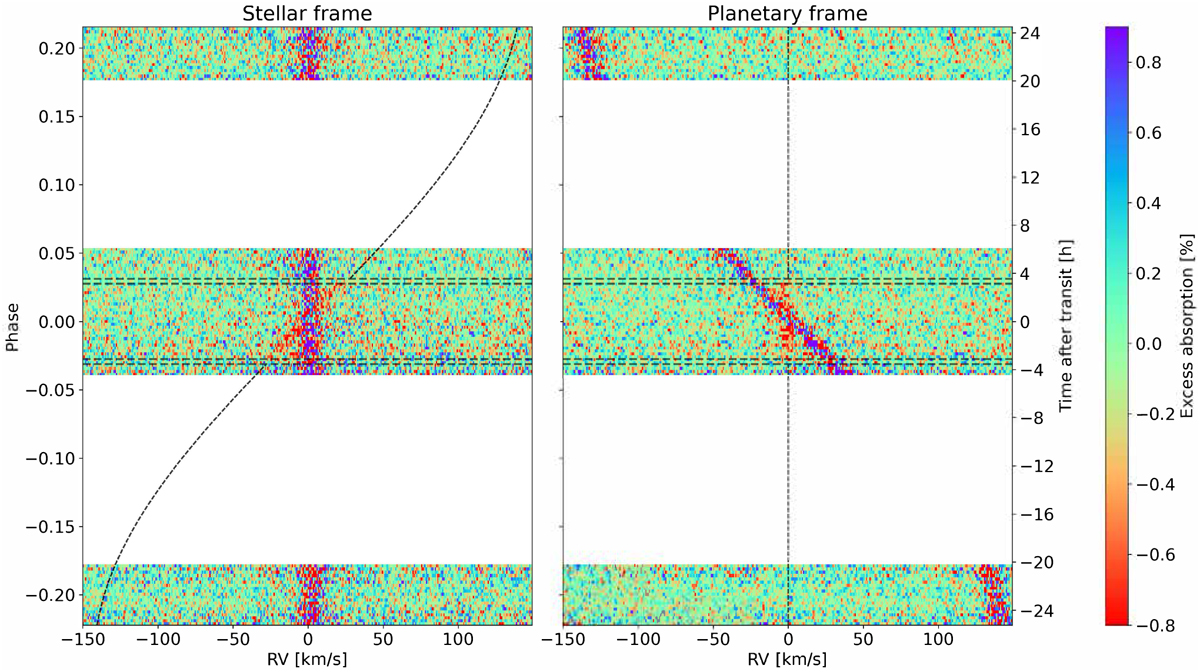
Excess absorption maps of KELT-11 b as a function of orbital phase, binned every 0.2% in phase, with both lines from the Na D doublet coadded. The dashed horizontal black lines indicate the transit contact points T1 to T4 from the start (bottom) until the end (top) of the transit. The dashed horizontal/diagonal black lines represent where the stacked sodium line should appear according to the orbital velocity of the planet; they are not traced inside the transit. Left: excess absorption maps in the stellar rest frame. Right: excess absorption maps in the planetary rest frame. Excess absorption in the sodium lines originating in the planetary atmosphere is clearly visible as a red signature over the duration of the transit. The thick multicolor traces correspond to the noisy parts of the stellar spectrum in the core of the Na D lines.
Current usage metrics show cumulative count of Article Views (full-text article views including HTML views, PDF and ePub downloads, according to the available data) and Abstracts Views on Vision4Press platform.
Data correspond to usage on the plateform after 2015. The current usage metrics is available 48-96 hours after online publication and is updated daily on week days.
Initial download of the metrics may take a while.