Fig. 2
Download original image
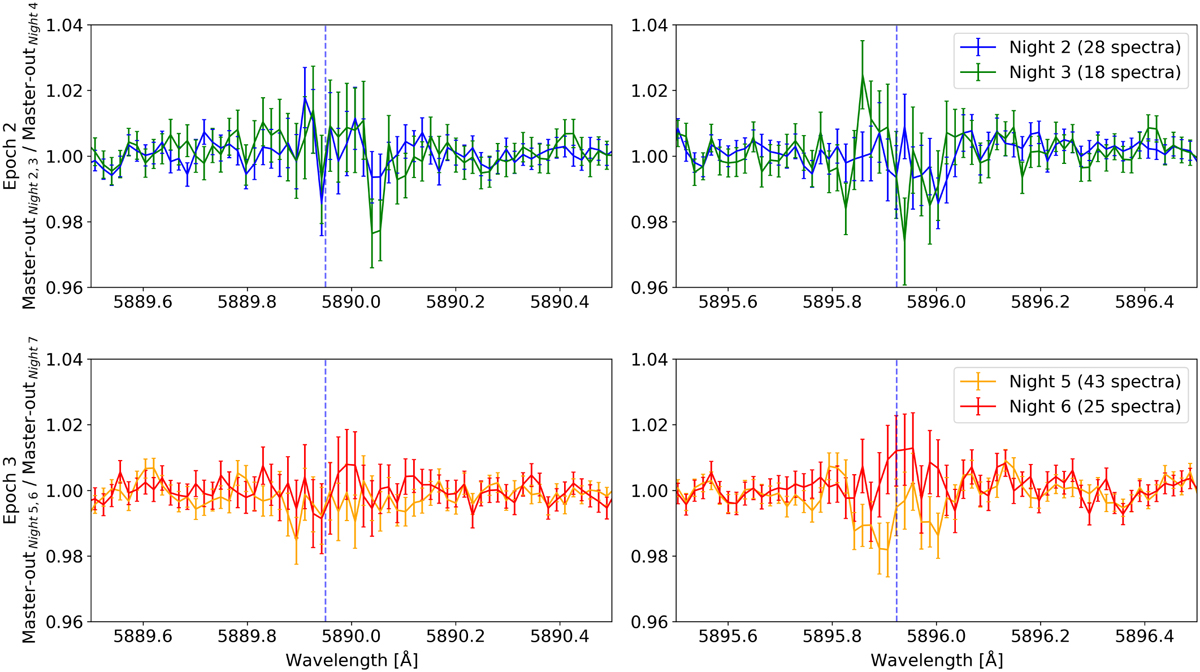
Masters-out of each night divided by the highest signal-to-noise master-out from their epoch (Nights 4 and 7, respectively), zoomed on each line core of the Na D doublet. This shows the discrepancy between each night master within their respective epoch compared to the noise level. The center of each line is represented by a dashed vertical blue line. Top: night masters residuals of Epoch 2. Bottom: night masters residuals of Epoch 3. Left: Na D2 line zoom. Right: Na D1 line zoom.
Current usage metrics show cumulative count of Article Views (full-text article views including HTML views, PDF and ePub downloads, according to the available data) and Abstracts Views on Vision4Press platform.
Data correspond to usage on the plateform after 2015. The current usage metrics is available 48-96 hours after online publication and is updated daily on week days.
Initial download of the metrics may take a while.