Fig. 9.
Download original image
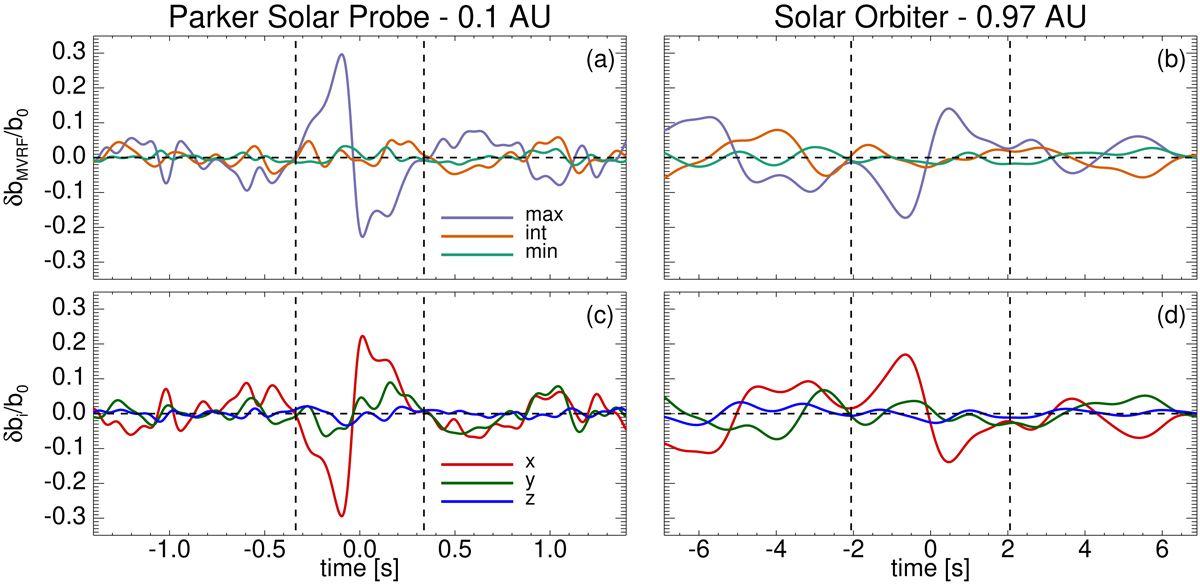
Example of two current sheets observed at 0.1 AU (left column), and at 0.97 AU (right column), centered at 02:57:24.99 UT on 28 September and at 02:29:42.04 UT on 25 September, respectively. Top row: components of the magnetic field fluctuations, defined in Eq. (11), in the minimum variance reference frame. Bottom row: components of the magnetic field fluctuations in the local magnetic field reference frame, where b0 is along the z-direction. Magnetic fluctuations are normalized to the local mean magnetic field strength, b0. The vertical dashed black lines mark the extension of the events, Δt′.
Current usage metrics show cumulative count of Article Views (full-text article views including HTML views, PDF and ePub downloads, according to the available data) and Abstracts Views on Vision4Press platform.
Data correspond to usage on the plateform after 2015. The current usage metrics is available 48-96 hours after online publication and is updated daily on week days.
Initial download of the metrics may take a while.