Fig. 7.
Download original image
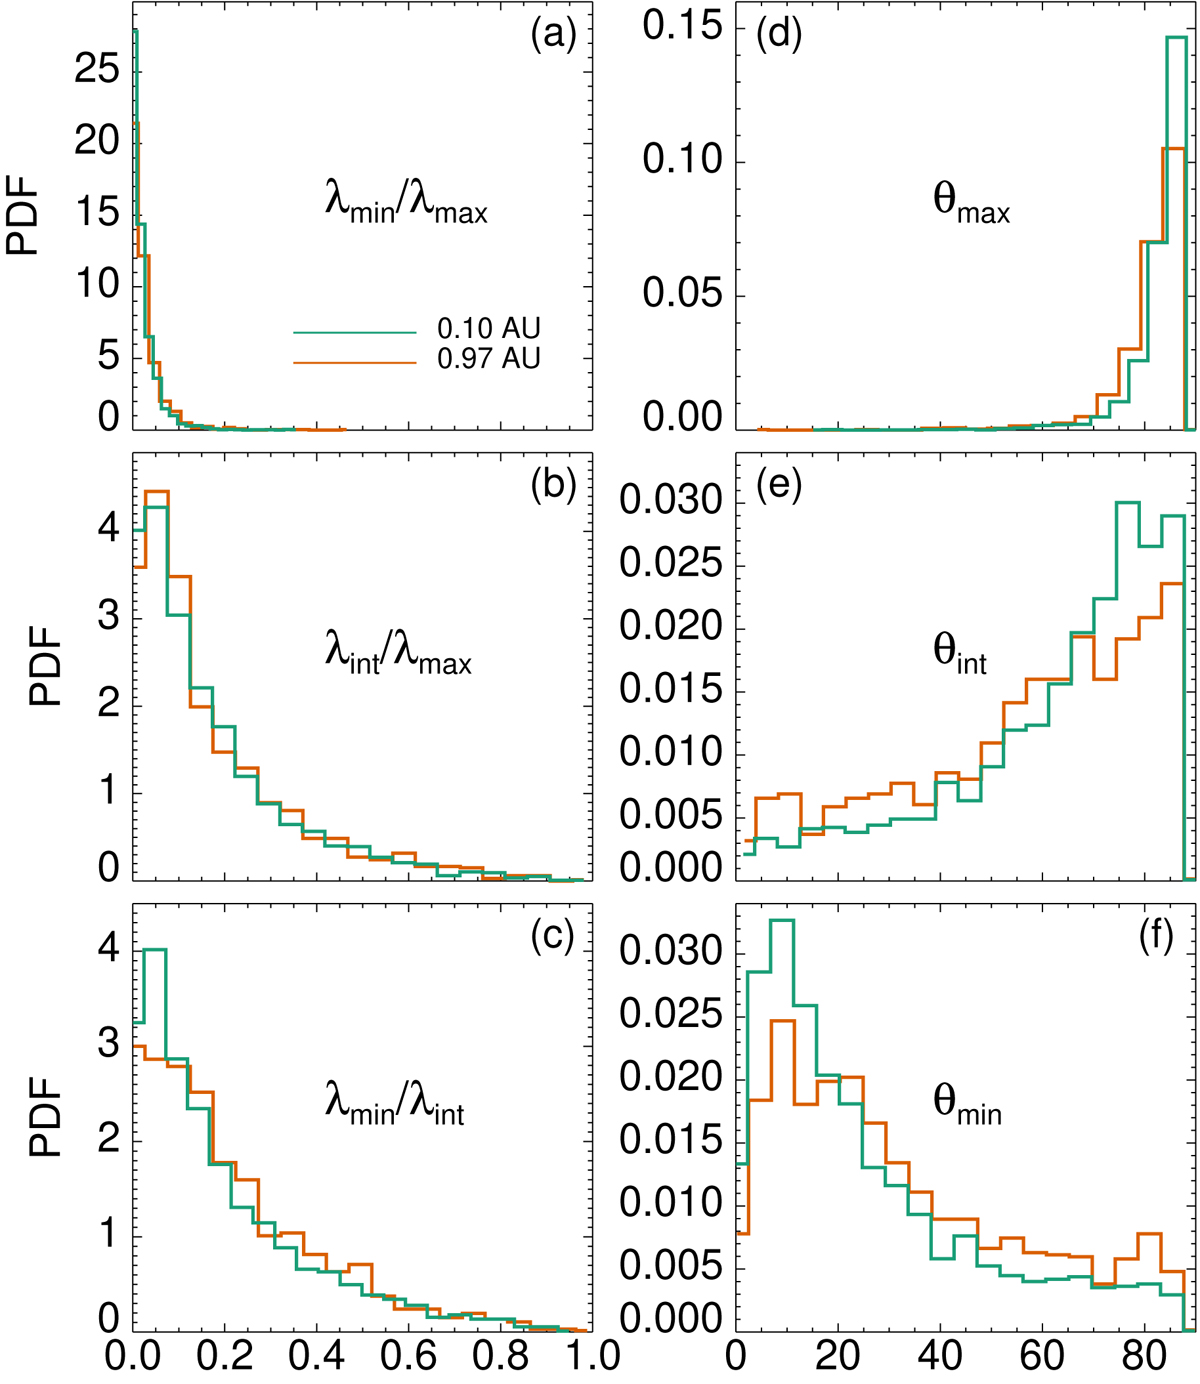
Statistical analysis of the observed coherent events in the minimum variance reference frame for the stream at 0.1 AU (green), and at 0.97 AU (orange). Left panels: PDFs for the minimum (a) and intermediate (b) eigenvalues normalized to the maximum eigenvalue, and for λmin/λint (c). Right panels: PDFs of the angles between the maximum (d), intermediate (e), and minimum (f) variance directions and the local magnetic field.
Current usage metrics show cumulative count of Article Views (full-text article views including HTML views, PDF and ePub downloads, according to the available data) and Abstracts Views on Vision4Press platform.
Data correspond to usage on the plateform after 2015. The current usage metrics is available 48-96 hours after online publication and is updated daily on week days.
Initial download of the metrics may take a while.