Fig. 6.
Download original image
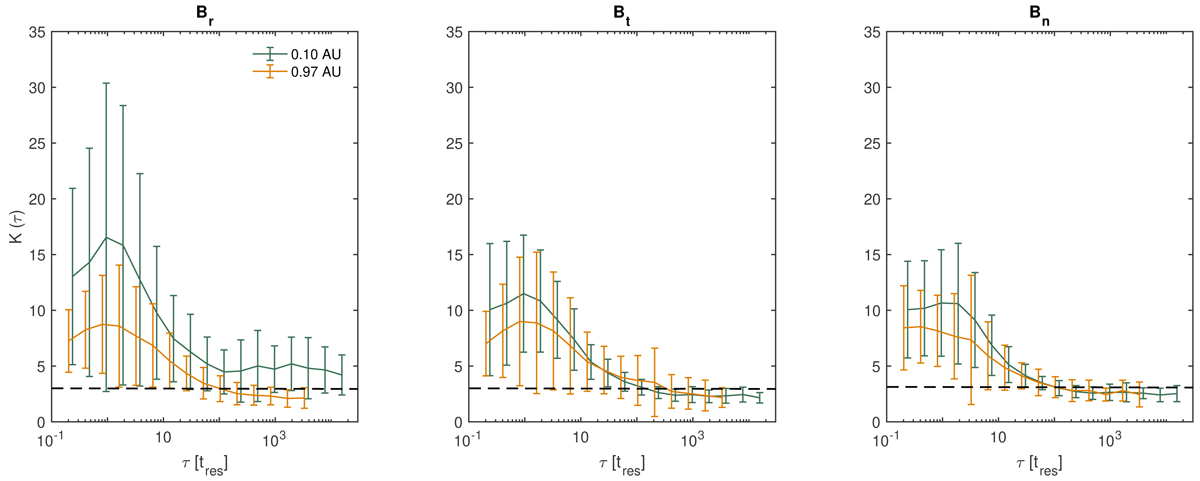
Kurtosis as a function of the time lag τ rescaled to the proton cyclotron resonance timescale tres = 1/fres = 2π(VA + vth)/(ΩcVsw) in lin-log axis. It is important to notice that the minimum timescale at which the kurtosis has been plotted corresponds to the highest frequency shown in the PSD in Fig. 4a. Smaller timescales indeed are highly affected by instrumental noise. Error bars are also displayed (see text for further details). The horizontal dashed line indicates the value of the kurtosis for a Gaussian distribution of the magnetic field increments, i.e., K(τ)=3.
Current usage metrics show cumulative count of Article Views (full-text article views including HTML views, PDF and ePub downloads, according to the available data) and Abstracts Views on Vision4Press platform.
Data correspond to usage on the plateform after 2015. The current usage metrics is available 48-96 hours after online publication and is updated daily on week days.
Initial download of the metrics may take a while.