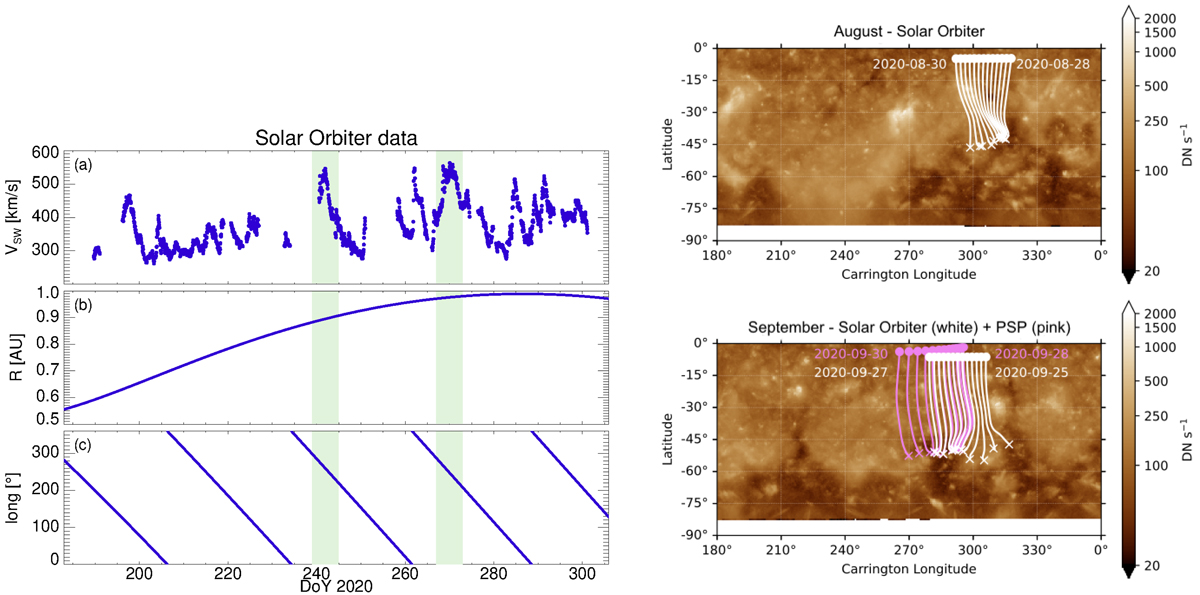
Fig. 1.
Download original image
Recurrent fast stream observed by Solar Orbiter and its source on the Sun. Left: hourly averaged Solar Orbiter data during the first months of the mission (between 15 July and 15 October 2020). From top to bottom: magnitude of the solar wind speed (a); distance from the Sun (b); and Carrington longitude (c), of the Solar Orbiter spacecraft. Right: partial synoptic maps from SDO/AIA 193 Å constructed from daily observations from 1 to 28 August (top panel) and 1 to 28 September (bottom panel). White and pink lines show magnetic field lines traced through a PFSS model from the source surface (dots) to the solar surface (crosses).
Current usage metrics show cumulative count of Article Views (full-text article views including HTML views, PDF and ePub downloads, according to the available data) and Abstracts Views on Vision4Press platform.
Data correspond to usage on the plateform after 2015. The current usage metrics is available 48-96 hours after online publication and is updated daily on week days.
Initial download of the metrics may take a while.