Fig. 3
Download original image
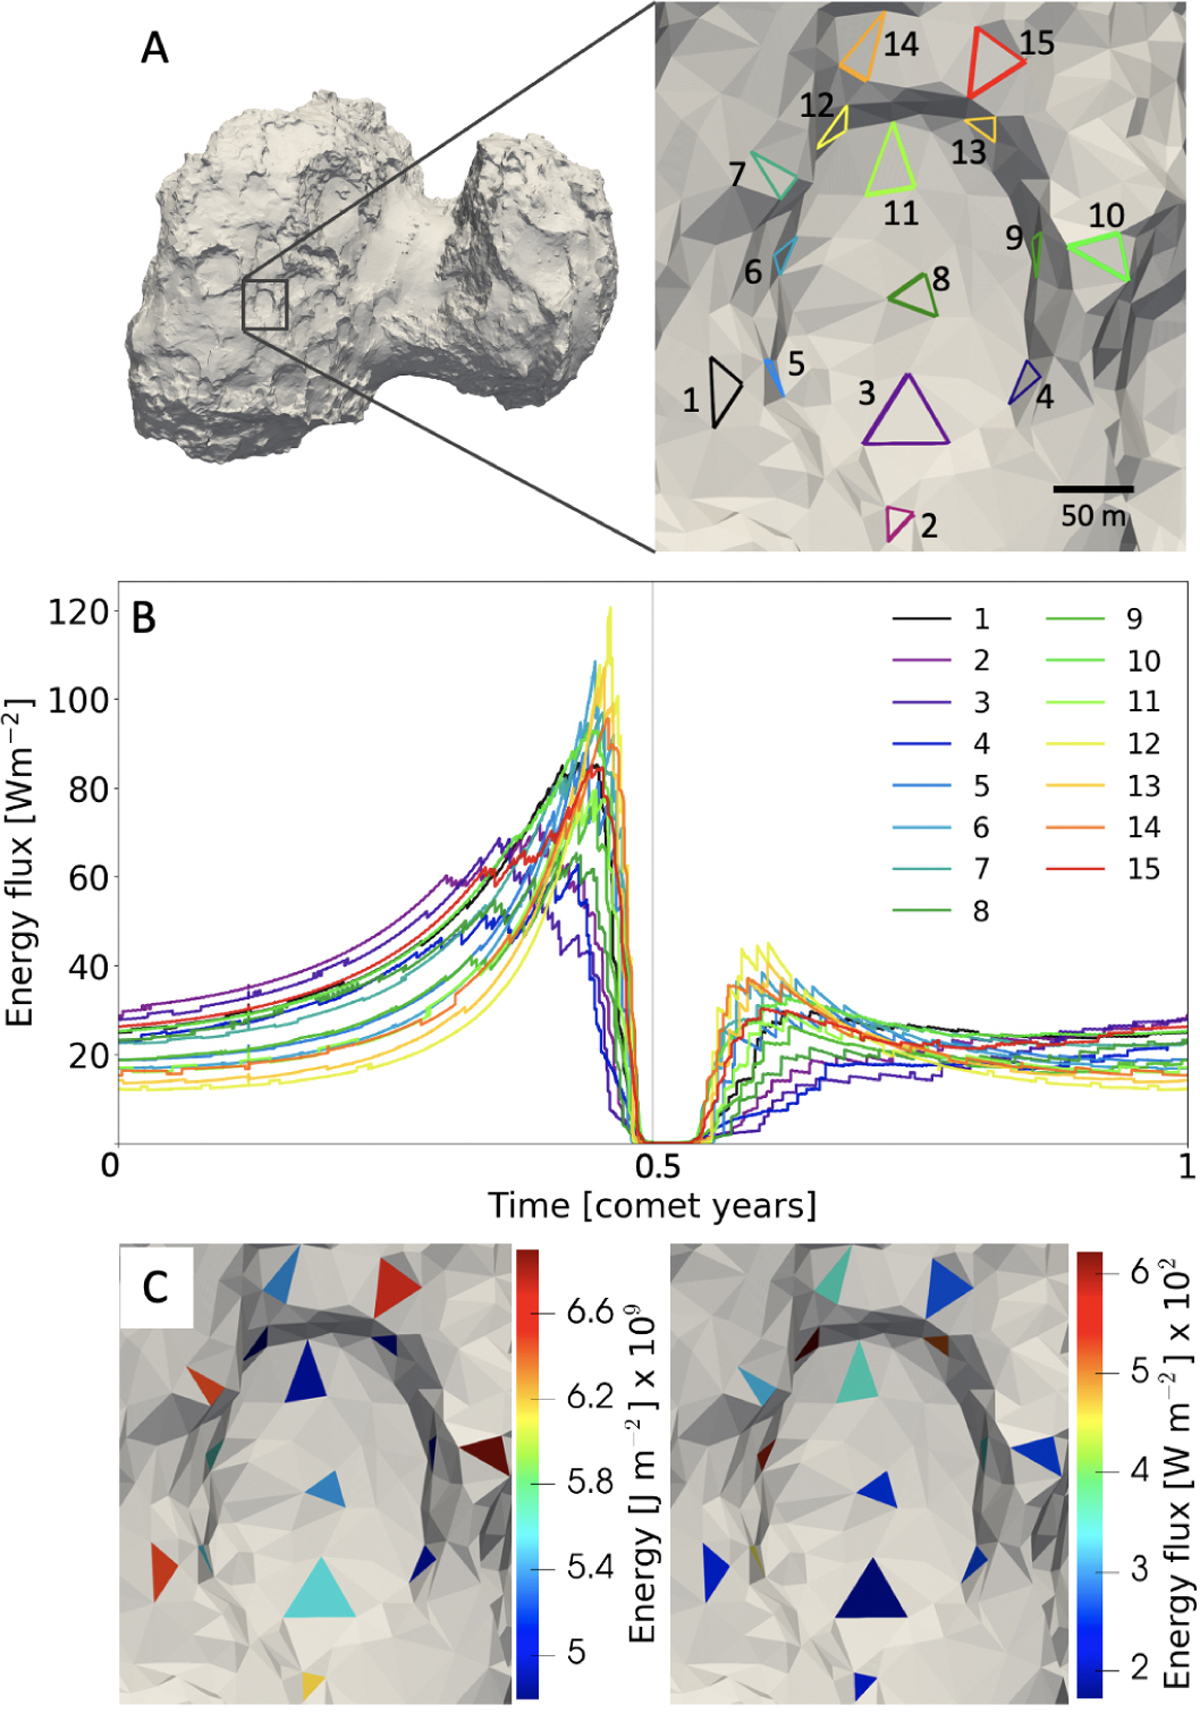
Pit selected for the study of the influence of initial parameters, and corresponding energy. A: the location of pit 5, and facets sampled on the plateaus, walls, and bottom. B: the energy received at the 15 facets over one complete orbit, averaged over a daily period window. The gray line marks the perihelion. C: the total quantity of energy integrated over one orbit (left) and the maximum reached during the perihelion (right).
Current usage metrics show cumulative count of Article Views (full-text article views including HTML views, PDF and ePub downloads, according to the available data) and Abstracts Views on Vision4Press platform.
Data correspond to usage on the plateform after 2015. The current usage metrics is available 48-96 hours after online publication and is updated daily on week days.
Initial download of the metrics may take a while.