Fig. 12
Download original image
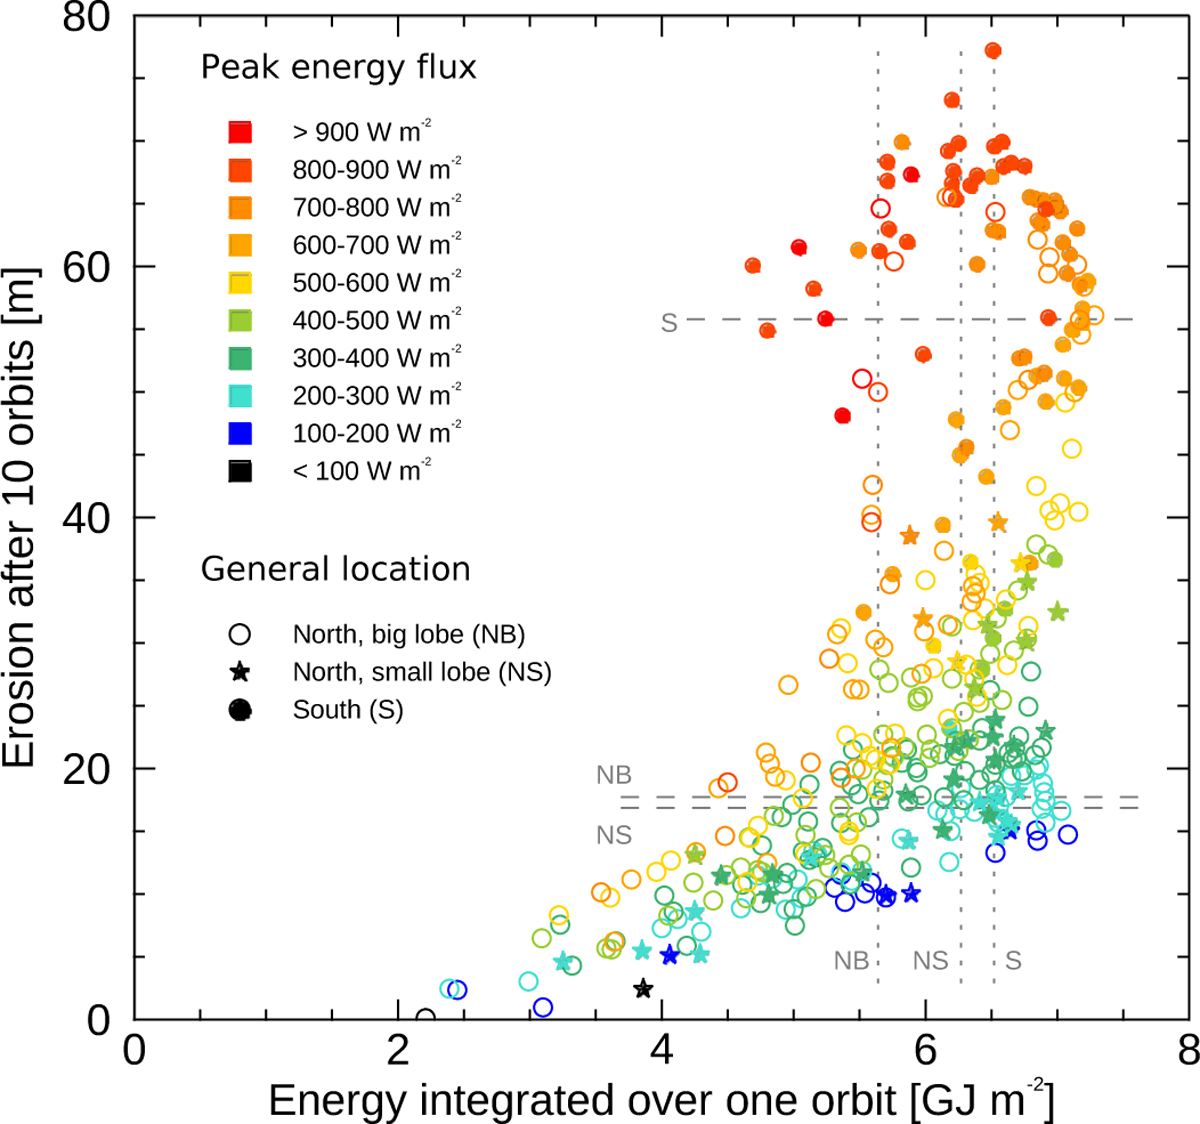
Erosion sustained at each facet as a function of the energy they receive, integrated over one orbit. The dotted gray lines show the median of this energy for the large regions, i.e., the small and big lobes on the northern hemisphere and the southern hemisphere. The dashed gray lines show the median of erosion sustained by the facets in these regions. The color code provides an indication of the peak energy received at or close to perihelion.
Current usage metrics show cumulative count of Article Views (full-text article views including HTML views, PDF and ePub downloads, according to the available data) and Abstracts Views on Vision4Press platform.
Data correspond to usage on the plateform after 2015. The current usage metrics is available 48-96 hours after online publication and is updated daily on week days.
Initial download of the metrics may take a while.