Open Access
Fig. 3.
Download original image
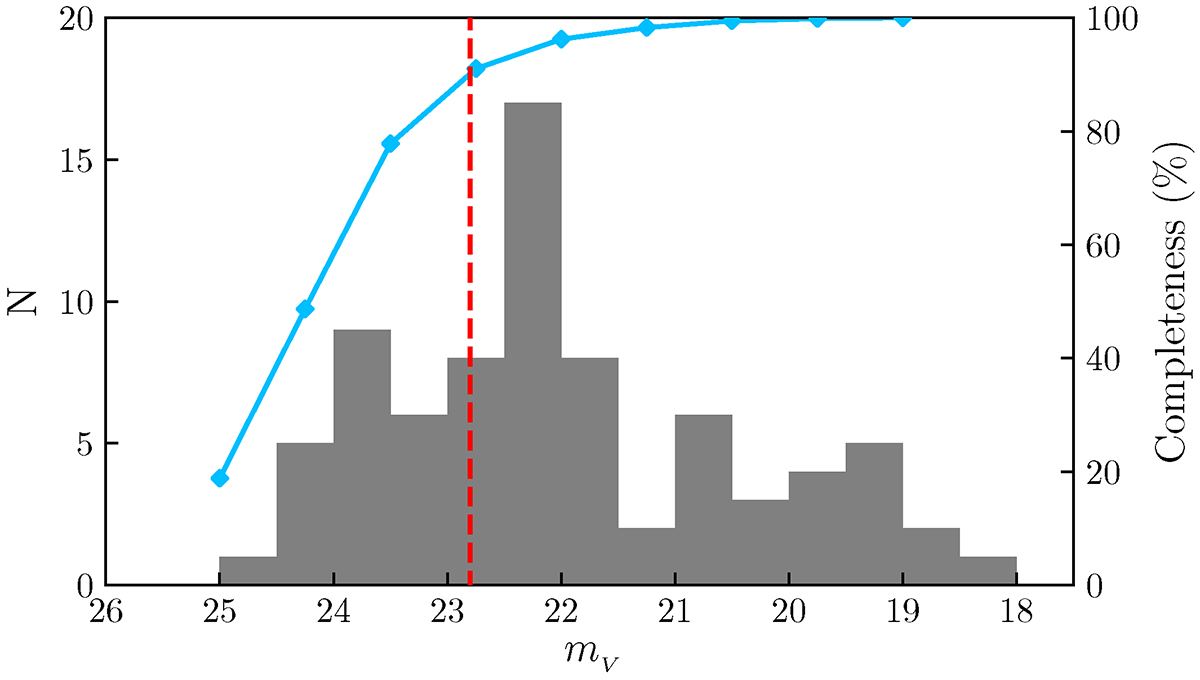
V-band magnitude distribution of the star clusters in NGC 2915. The cyan curve indicates how completeness changes with source brightness. The red vertical dashed line marks the magnitude limit (V = 22.8 mag) corresponding to the 90% completeness. Only the star clusters brighter than this limit are used for our analysis.
Current usage metrics show cumulative count of Article Views (full-text article views including HTML views, PDF and ePub downloads, according to the available data) and Abstracts Views on Vision4Press platform.
Data correspond to usage on the plateform after 2015. The current usage metrics is available 48-96 hours after online publication and is updated daily on week days.
Initial download of the metrics may take a while.