Fig. 16.
Download original image
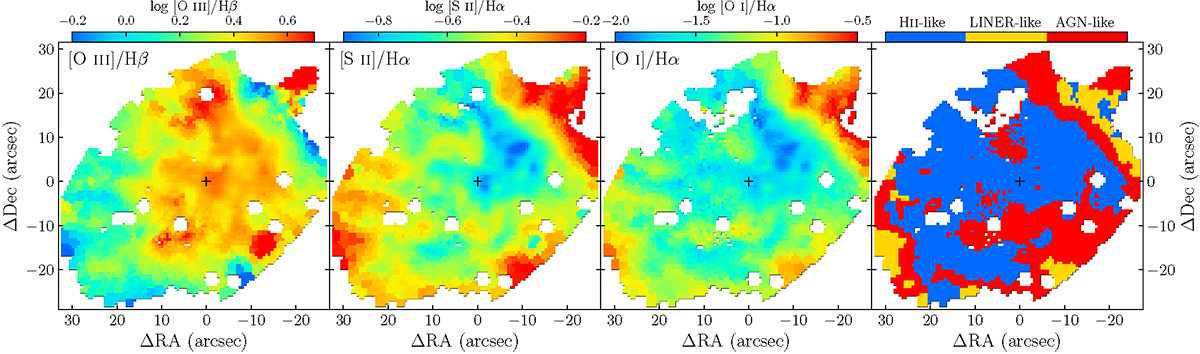
Spatial variation of the emission line flux ratio [O III]λ5007/Hβ, [S II]λλ6717, 6731/Hα and [O I]λ6300/Hα. Only spaxels with S/N > 10 in the involved emission lines are plotted. The rightmost panel indicates the spatial distribution of possible excitation sources implied by the [O III]λ5007/Hβ vs. [O I]λ6300/Hα diagnostic diagram.
Current usage metrics show cumulative count of Article Views (full-text article views including HTML views, PDF and ePub downloads, according to the available data) and Abstracts Views on Vision4Press platform.
Data correspond to usage on the plateform after 2015. The current usage metrics is available 48-96 hours after online publication and is updated daily on week days.
Initial download of the metrics may take a while.