Fig. 2
Download original image
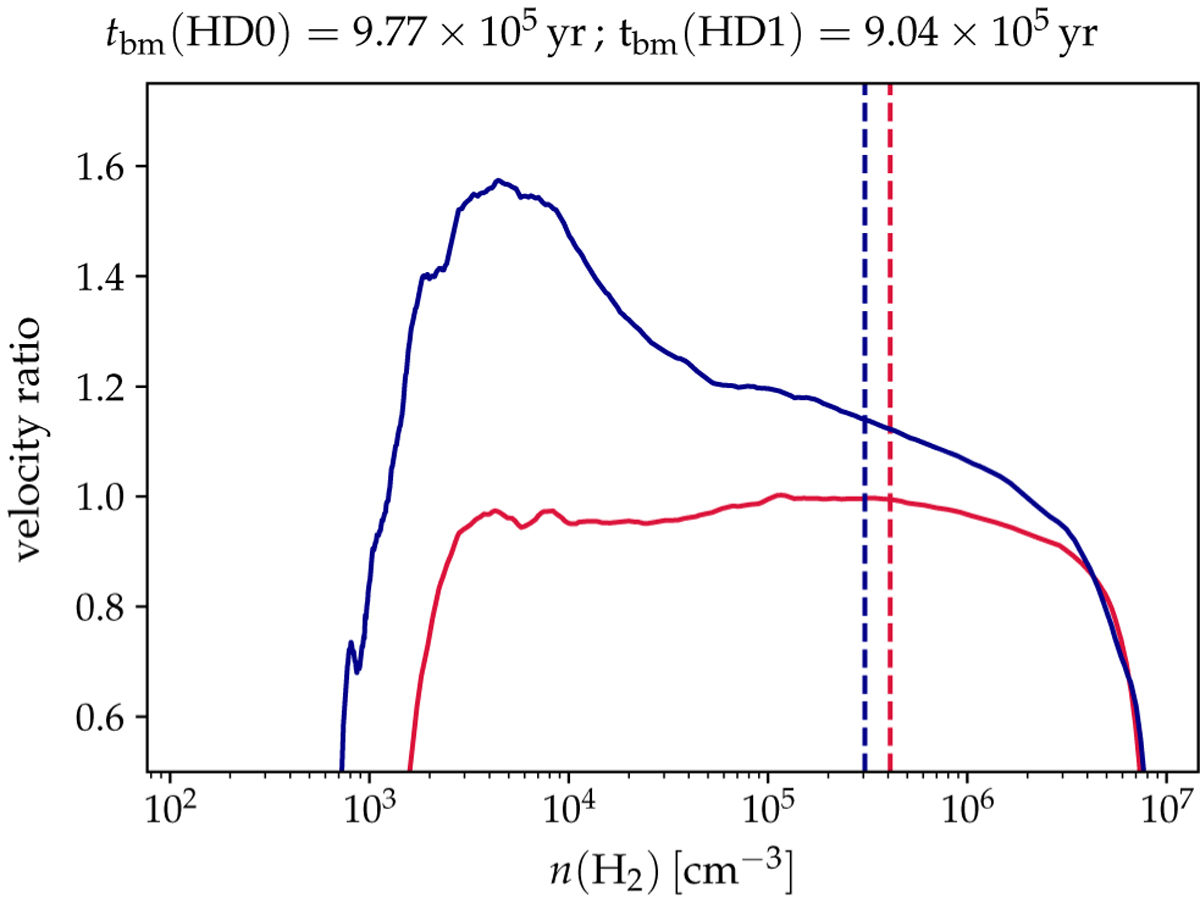
Ratios of the HD0 (red) and HD1 (blue) velocity profiles to the KC velocity profile as a function of volume density at the best-fit times in the HD0 and HD1 simulations, indicated above the figure. The positions of the infall velocity peak in the HD0 and HD1 simulations are shown as dashed vertical lines as a guide to the eye.
Current usage metrics show cumulative count of Article Views (full-text article views including HTML views, PDF and ePub downloads, according to the available data) and Abstracts Views on Vision4Press platform.
Data correspond to usage on the plateform after 2015. The current usage metrics is available 48-96 hours after online publication and is updated daily on week days.
Initial download of the metrics may take a while.