Fig. 1
Download original image
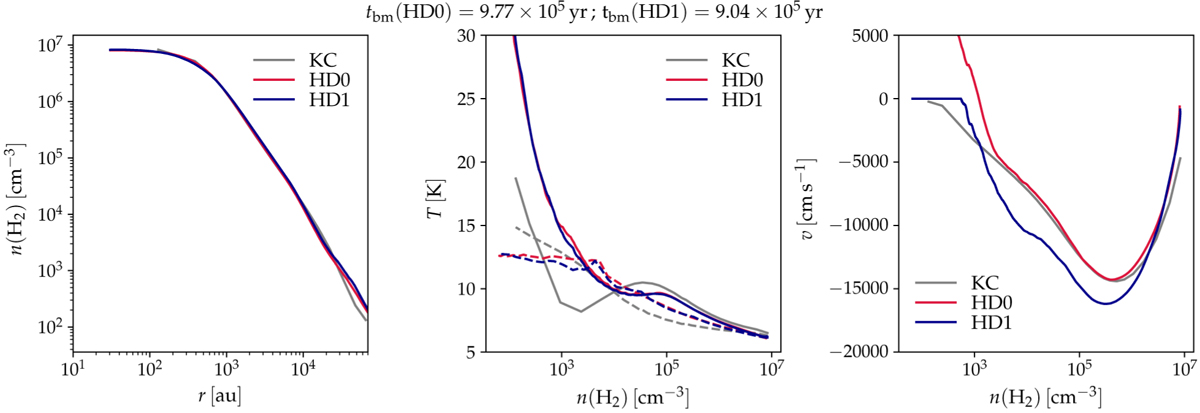
Comparison of the physical structure at tbm in simulations HD0 (red) and HD1 (blue). Left panel: volume density as a function of radius. In the middle panel, the solid and dashed lines represent the gas and dust temperature, respectively, shown as a function of volume density. Right panel: infall velocity as a function of volume density. The gray curves show the corresponding data from the KC model. The values of tbm in simulations HD0 and HD1 are shown on top.
Current usage metrics show cumulative count of Article Views (full-text article views including HTML views, PDF and ePub downloads, according to the available data) and Abstracts Views on Vision4Press platform.
Data correspond to usage on the plateform after 2015. The current usage metrics is available 48-96 hours after online publication and is updated daily on week days.
Initial download of the metrics may take a while.