Open Access
Fig. A.1
Download original image
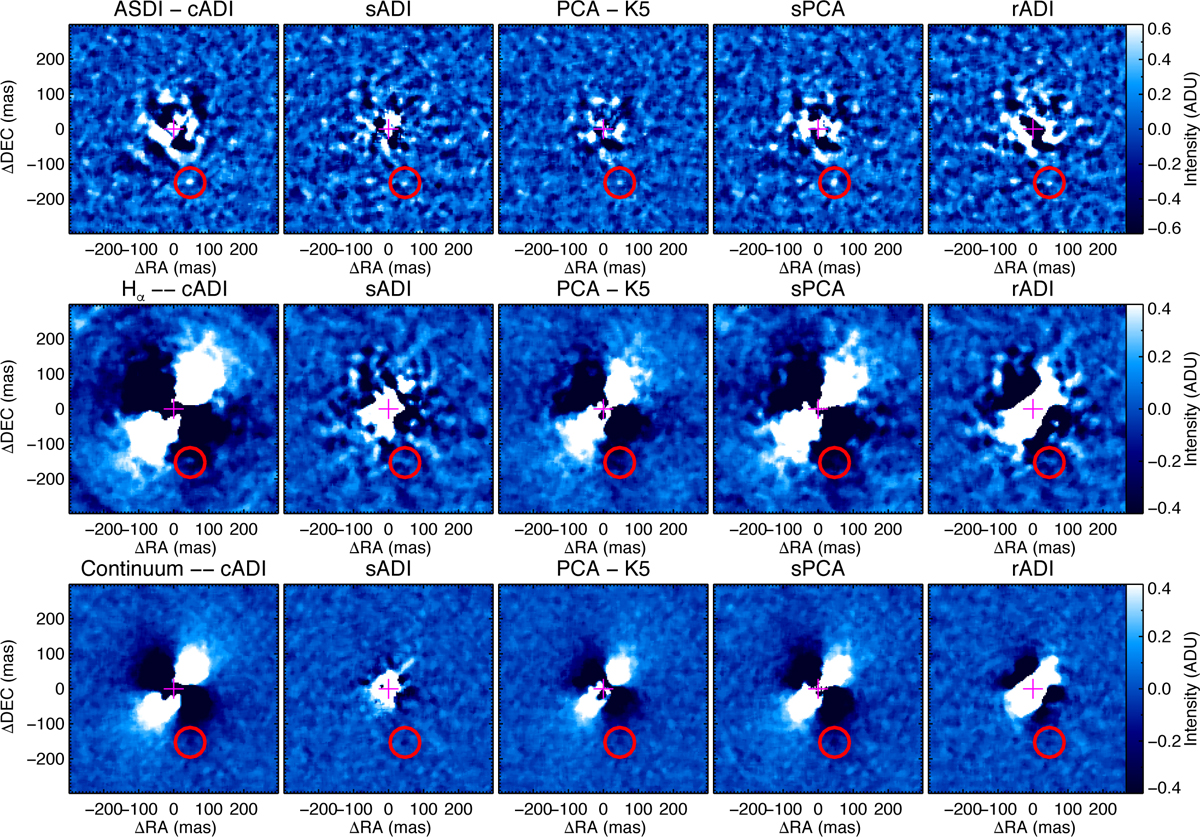
ASDI (top) and ADI N_Ha (middle) and CntHa (bottom) images of TW Hya using different processing techniques. In the case of PCA processing, we show the results obtained when considering five components (denoted with K5). The bright spot detected at ~160mas SW is encircled in all the images.
Current usage metrics show cumulative count of Article Views (full-text article views including HTML views, PDF and ePub downloads, according to the available data) and Abstracts Views on Vision4Press platform.
Data correspond to usage on the plateform after 2015. The current usage metrics is available 48-96 hours after online publication and is updated daily on week days.
Initial download of the metrics may take a while.