Fig. 5
Download original image
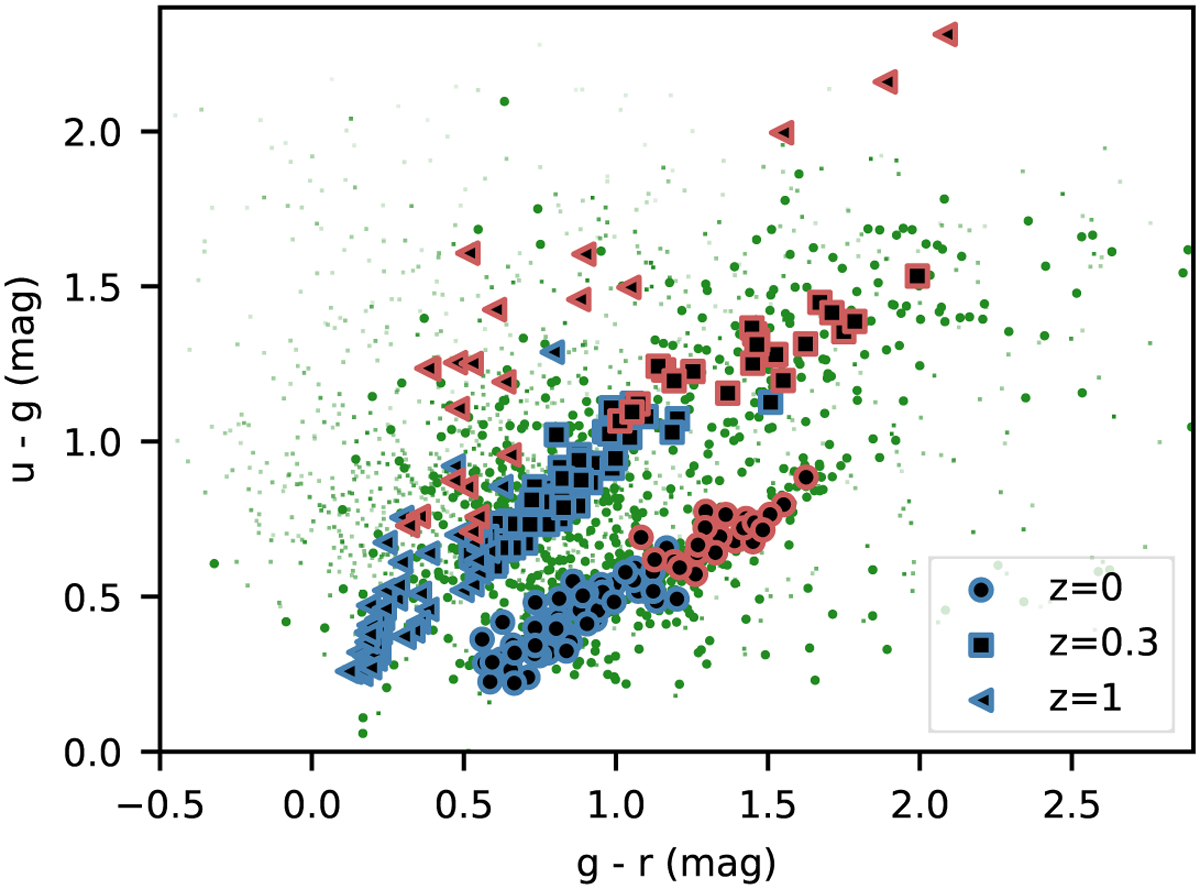
Colour-colour diagram of the miniJPAS catalogue (green points) and the selected templates (different markings). Green point intensity corresponds to the galaxy g-band flux. The shapes of the template markings indicate the same templates at three distinct redshifts. Blue and red colours indicate whether a late- or early type prior was applied to the given template (see Sect. 5.4).
Current usage metrics show cumulative count of Article Views (full-text article views including HTML views, PDF and ePub downloads, according to the available data) and Abstracts Views on Vision4Press platform.
Data correspond to usage on the plateform after 2015. The current usage metrics is available 48-96 hours after online publication and is updated daily on week days.
Initial download of the metrics may take a while.