Fig. A.1
Download original image
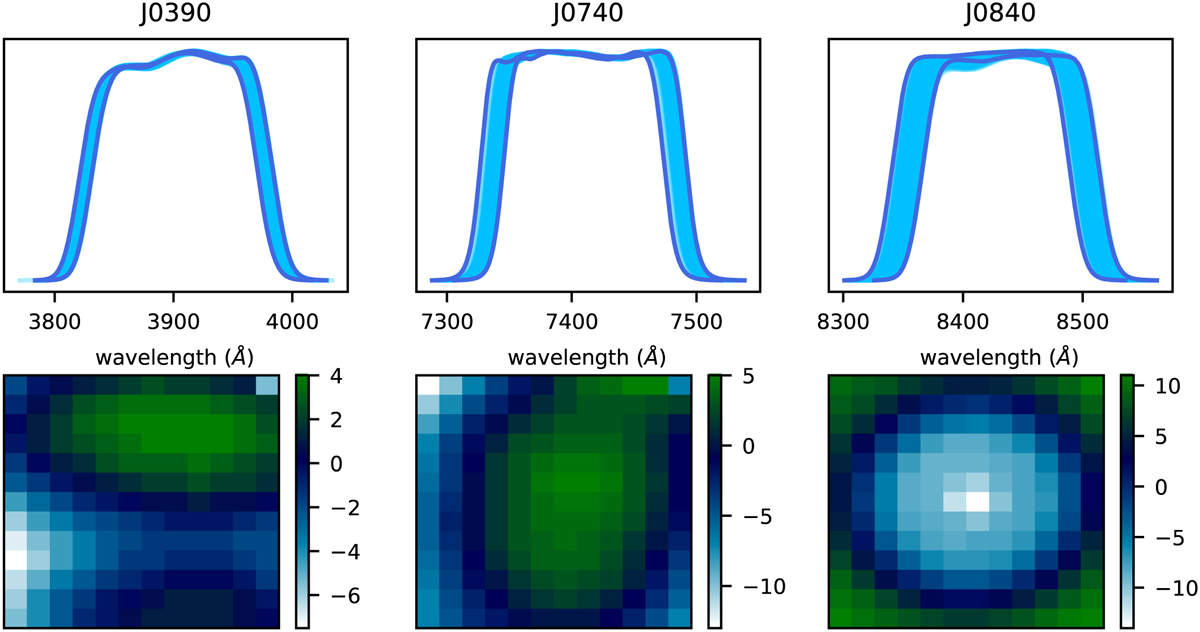
Measured passbands and their overall shape on the physical filter for three different J-PAS filter. All the passbands (top panel) on a single filter were measured in a 12 by 13 grid (bottom panel). Darker blue lines on the top panels show the two most opposed transmission curves of that filter. The colourbar on the bottom panels indicates each passband’s central wavelength difference from the mean passband.
Current usage metrics show cumulative count of Article Views (full-text article views including HTML views, PDF and ePub downloads, according to the available data) and Abstracts Views on Vision4Press platform.
Data correspond to usage on the plateform after 2015. The current usage metrics is available 48-96 hours after online publication and is updated daily on week days.
Initial download of the metrics may take a while.