Fig. 19
Download original image
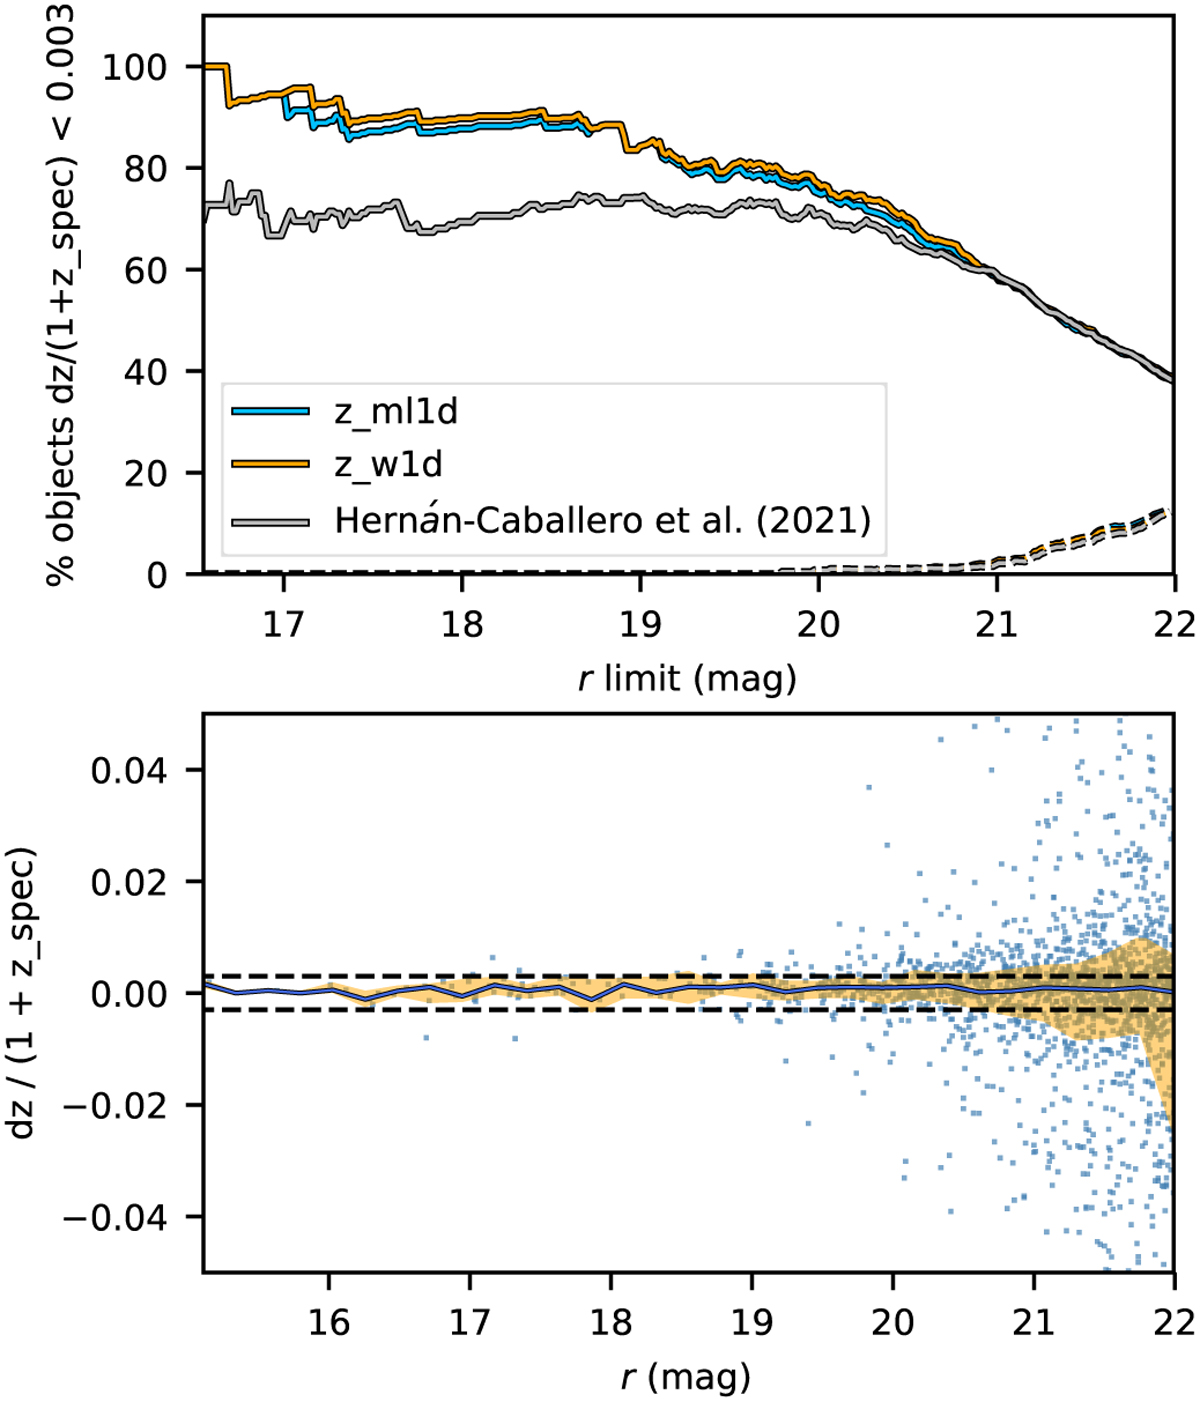
TOPz results based on the brightness of galaxies. Upper panel: fraction of galaxies within the J-PAS target accuracy (solid lines) and outliers (dashed lines) depending on the limiting magnitude of the sample. Colours show z_mlld (blue) and z_wld (orange) redshift estimators from TOPz and results from miniJPAS database (grey). Lower panel: photometric redshift accuracy for individual galaxies alongside their apparent brightness (blue points). The blue line marks the binned median value, the shaded area is where 50% of the binned data lies and the dashed black lines mark the 0.3% accuracy limit.
Current usage metrics show cumulative count of Article Views (full-text article views including HTML views, PDF and ePub downloads, according to the available data) and Abstracts Views on Vision4Press platform.
Data correspond to usage on the plateform after 2015. The current usage metrics is available 48-96 hours after online publication and is updated daily on week days.
Initial download of the metrics may take a while.