Fig. 17
Download original image
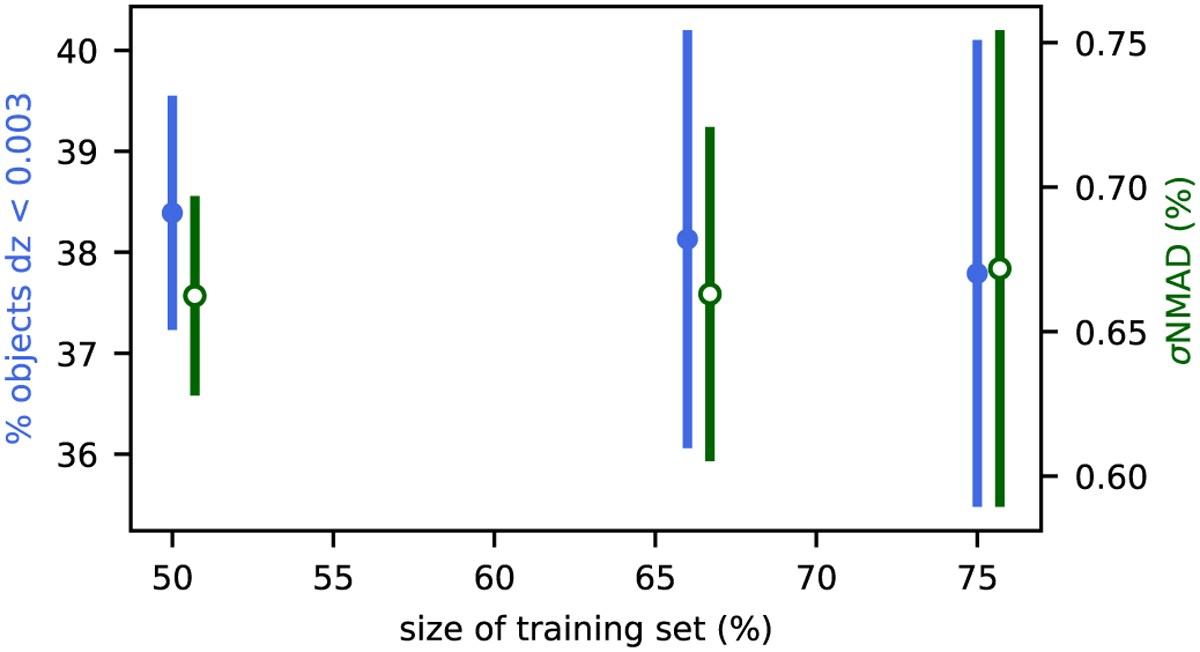
Impact on redshift estimation when two separate subsets are used for training and validation. The x-axis shows the ratio of objects (from to the full catalogue with r < 22 mag) that are used for testing. Each marking is comprised of 10 randomly selected subsets and is plotted as the mean value and standard deviation of the distribution of values. The blue points follow the percentage of objects that fit the J-PAS accuracy criteria while the green points follow the achieved median absolute deviation for the normalised distribution (σNMAD). The green points are shifted slightly right for better visibility.
Current usage metrics show cumulative count of Article Views (full-text article views including HTML views, PDF and ePub downloads, according to the available data) and Abstracts Views on Vision4Press platform.
Data correspond to usage on the plateform after 2015. The current usage metrics is available 48-96 hours after online publication and is updated daily on week days.
Initial download of the metrics may take a while.