Open Access
Fig. 14
Download original image
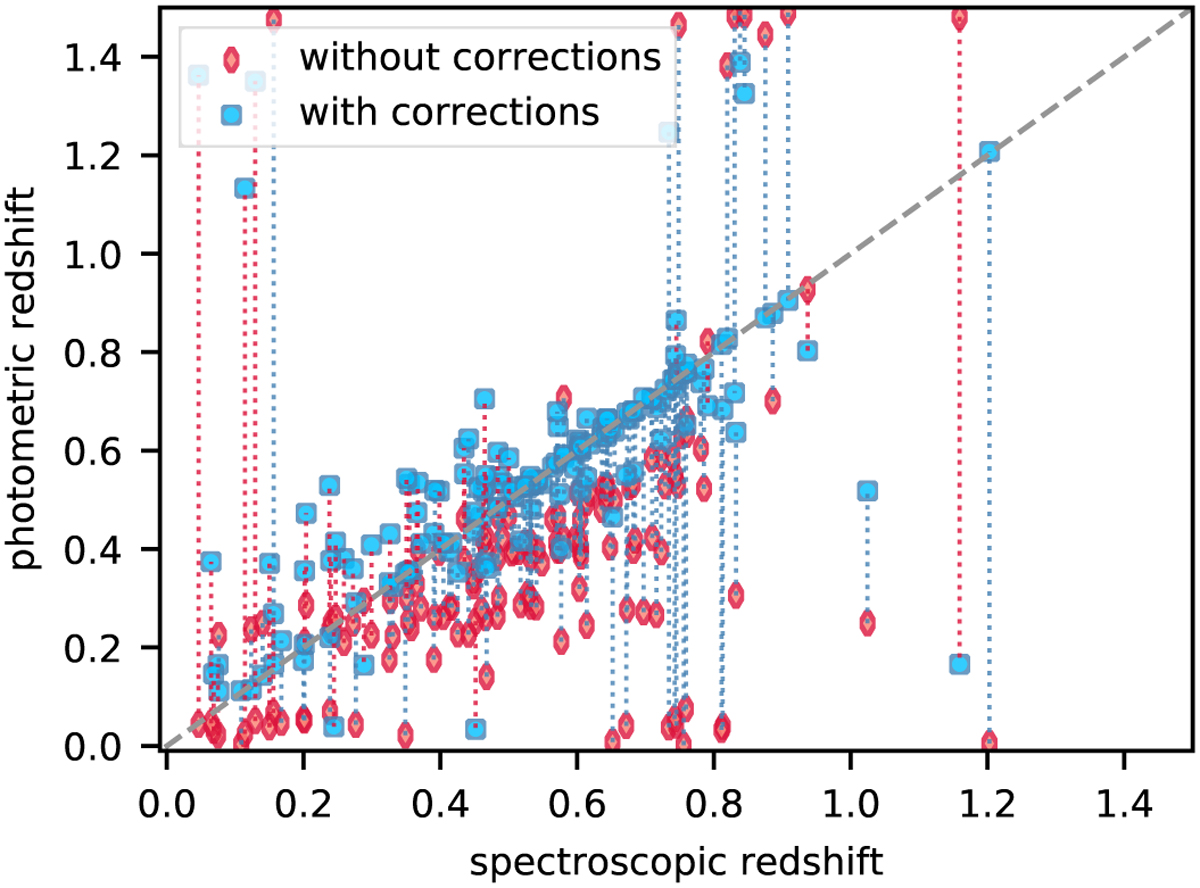
Effect of our photometry corrections to the redshift estimations. Red diamonds are the photo-z values with raw data and blue points are the photo-z values after correcting the photometry. The dotted lines indicate whether the corrections improve (blue line) or worsen (red line) the photo-z estimation.
Current usage metrics show cumulative count of Article Views (full-text article views including HTML views, PDF and ePub downloads, according to the available data) and Abstracts Views on Vision4Press platform.
Data correspond to usage on the plateform after 2015. The current usage metrics is available 48-96 hours after online publication and is updated daily on week days.
Initial download of the metrics may take a while.