Fig. 10
Download original image
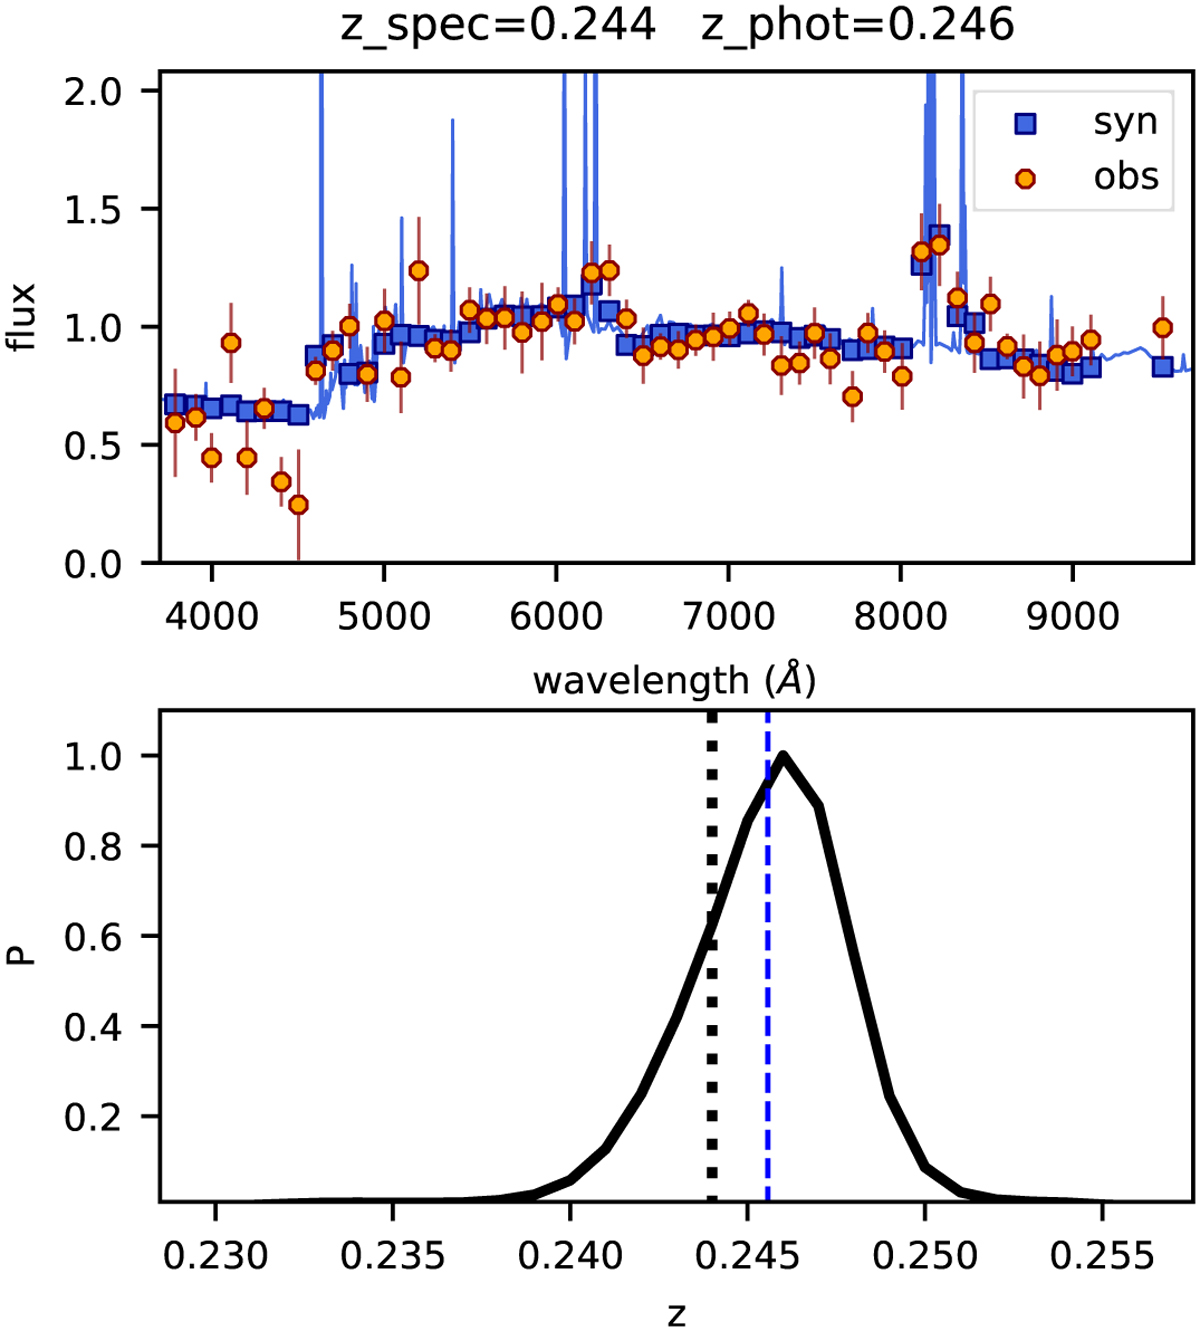
Example of a fitted template matching the photometry. The upper panel shows the match between the observed (orange circle) and the synthetic photometry (blue box) of the best template (blue line). The lower panel is the PDF from TOPz with dashed blue line showing the weighted redshift (z_wld) and black dotted line the spectroscopic redshift.
Current usage metrics show cumulative count of Article Views (full-text article views including HTML views, PDF and ePub downloads, according to the available data) and Abstracts Views on Vision4Press platform.
Data correspond to usage on the plateform after 2015. The current usage metrics is available 48-96 hours after online publication and is updated daily on week days.
Initial download of the metrics may take a while.