Fig. 9
Download original image
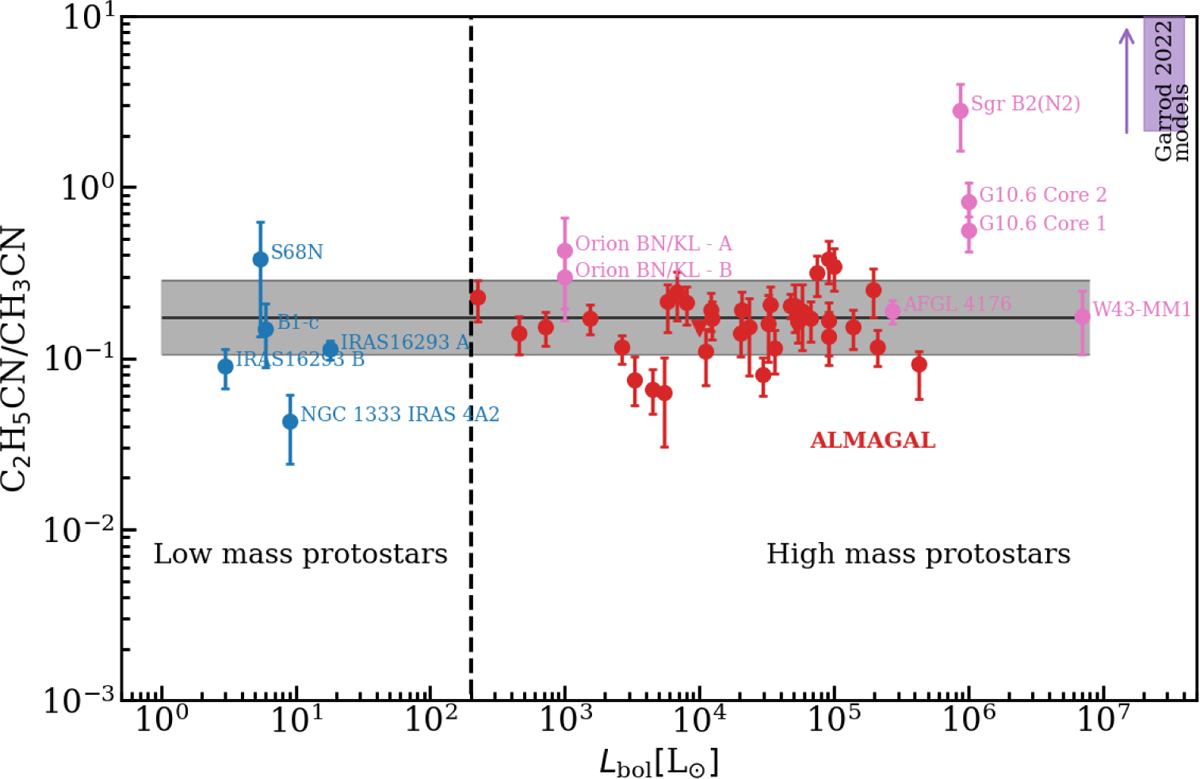
Column density ratio of C2H5CN to CH3CN versus bolometric luminosity for low- and high-mass sources. The red points show the values for ALMAGAL sources from this work. Blue and pink show values for low- and high-mass protostars taken from the literature (see Table E.4 for the references). Moreover, the purple bar shows the range of C2H5CN/CH3CN peak gas-phase values from Garrod et al. (2022) in the warm-up stages with slow, medium and fast pace (from their Table 17, final model setup). The purple arrow shows that the range of models are higher than the range in this plot. Upward triangles show lower limits and downward triangles show upper limits. Grey solid line and shaded gray area show the mean and standard deviation weighted by the uncertainty on the log10 of each column density ratio after eliminating upper and lower limits. Moreover, Sgr B2(N2) is eliminated in the derivation of mean and standard deviation, as it often seems to be an outlier.
Current usage metrics show cumulative count of Article Views (full-text article views including HTML views, PDF and ePub downloads, according to the available data) and Abstracts Views on Vision4Press platform.
Data correspond to usage on the plateform after 2015. The current usage metrics is available 48-96 hours after online publication and is updated daily on week days.
Initial download of the metrics may take a while.