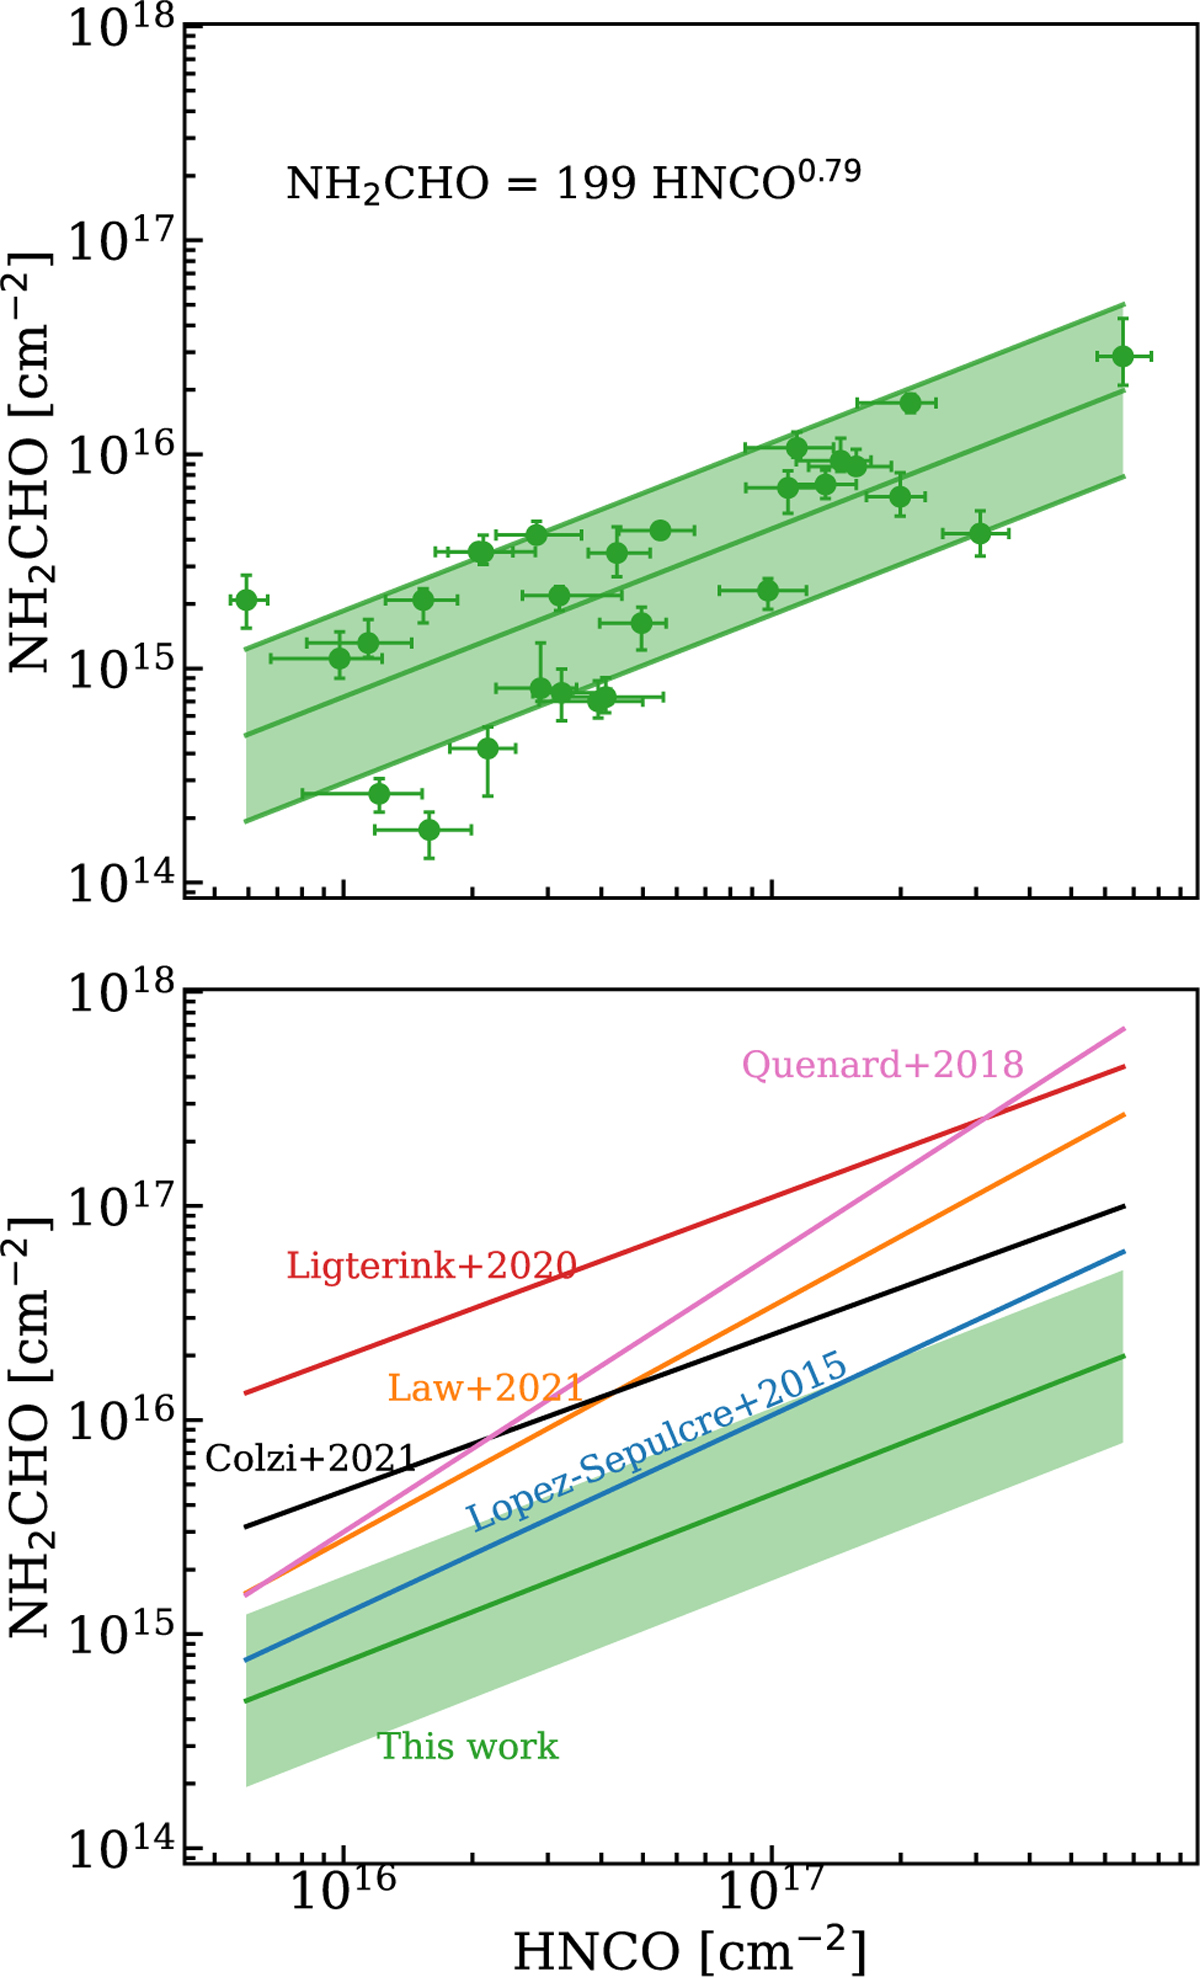
Fig. 8
Download original image
Column density of NH2CHO versus column density of HNCO. Top panel: data points from the ALMAGAL survey found in this work with the best fit plotted as the middle solid line and the shaded green area showing the 68 percentile scatter in the data. Bottom panel: compares the fitted data in our work by studies from López-Sepulcre et al. (2015), Quénard et al. (2018), Ligterink et al. (2020), Law et al. (2021) and Colzi et al. (2021). The curves for López-Sepulcre et al. (2015), Quénard et al. (2018) and Colzi et al. (2021) are taken from the fit to abundances of NH2CHO and HNCO and are normalized here as explained in the text: only slopes can be compared, not the absolute values.
Current usage metrics show cumulative count of Article Views (full-text article views including HTML views, PDF and ePub downloads, according to the available data) and Abstracts Views on Vision4Press platform.
Data correspond to usage on the plateform after 2015. The current usage metrics is available 48-96 hours after online publication and is updated daily on week days.
Initial download of the metrics may take a while.