Fig. 5
Download original image
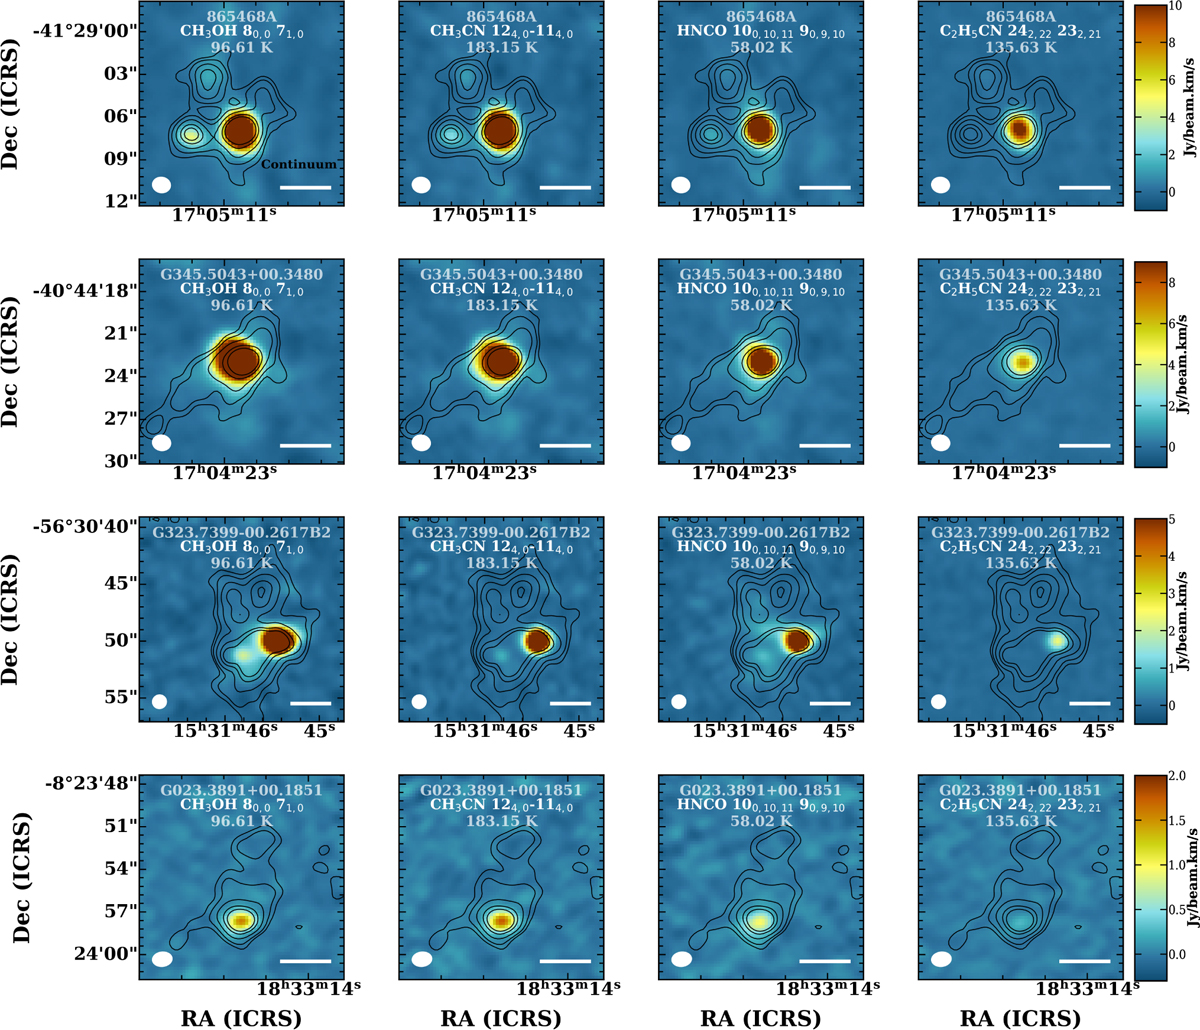
Moment zero maps of four selected lines for four sources included in Fig. 1. The line, name of the source and Eup of the line are printed in white at the middle top of each panel. The beam is also shown on the bottom left of each panel. The continuum contours are shown in black and are at [3, 5, 10, 20, 30]σcont with σcont for the sources from top to bottom being 7.6, 4.1, 1.9 and 0.8 mJy beam−1, respectively. The scale bars on the bottom right of each panel from top to bottom show lengths of 10942, 7199, 11518, and 39089 au at the distances of the sources.
Current usage metrics show cumulative count of Article Views (full-text article views including HTML views, PDF and ePub downloads, according to the available data) and Abstracts Views on Vision4Press platform.
Data correspond to usage on the plateform after 2015. The current usage metrics is available 48-96 hours after online publication and is updated daily on week days.
Initial download of the metrics may take a while.