Open Access
Fig. D.5
Download original image
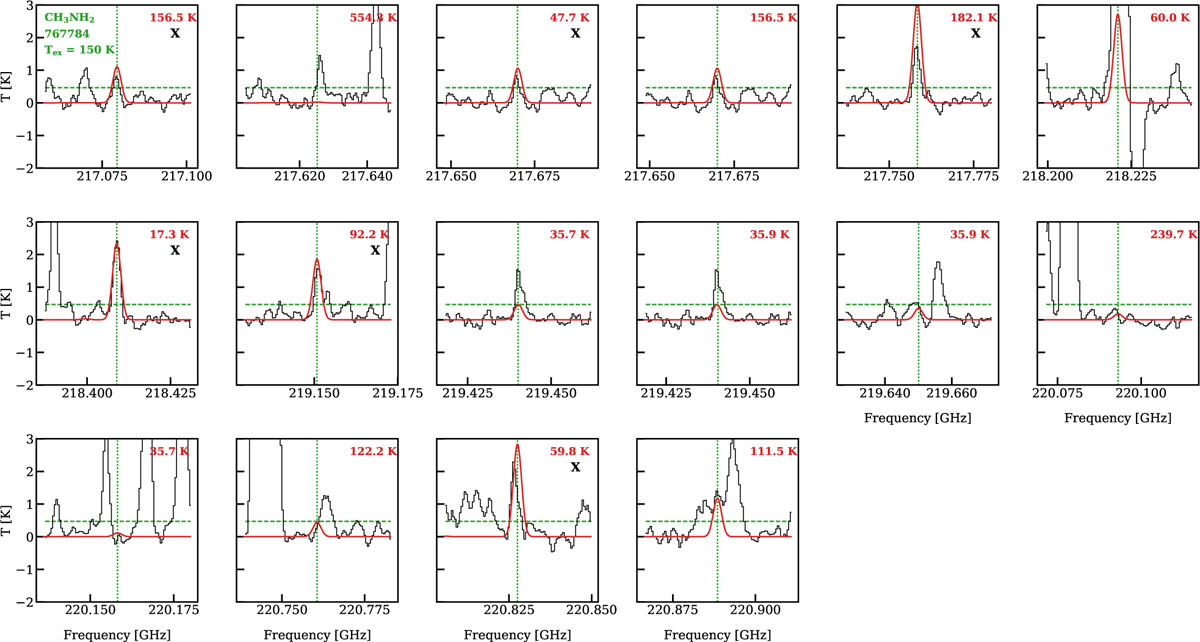
Showing that excitation temperature of 150 K does not match the observations for CH3NH2 in source 767784. The various symbols are the same as Fig. 2. Again here some lines are overestimated and if the column density is decreased the lines that are perfect fits now will be underestimated.
Current usage metrics show cumulative count of Article Views (full-text article views including HTML views, PDF and ePub downloads, according to the available data) and Abstracts Views on Vision4Press platform.
Data correspond to usage on the plateform after 2015. The current usage metrics is available 48-96 hours after online publication and is updated daily on week days.
Initial download of the metrics may take a while.