Open Access
Fig. 13
Download original image
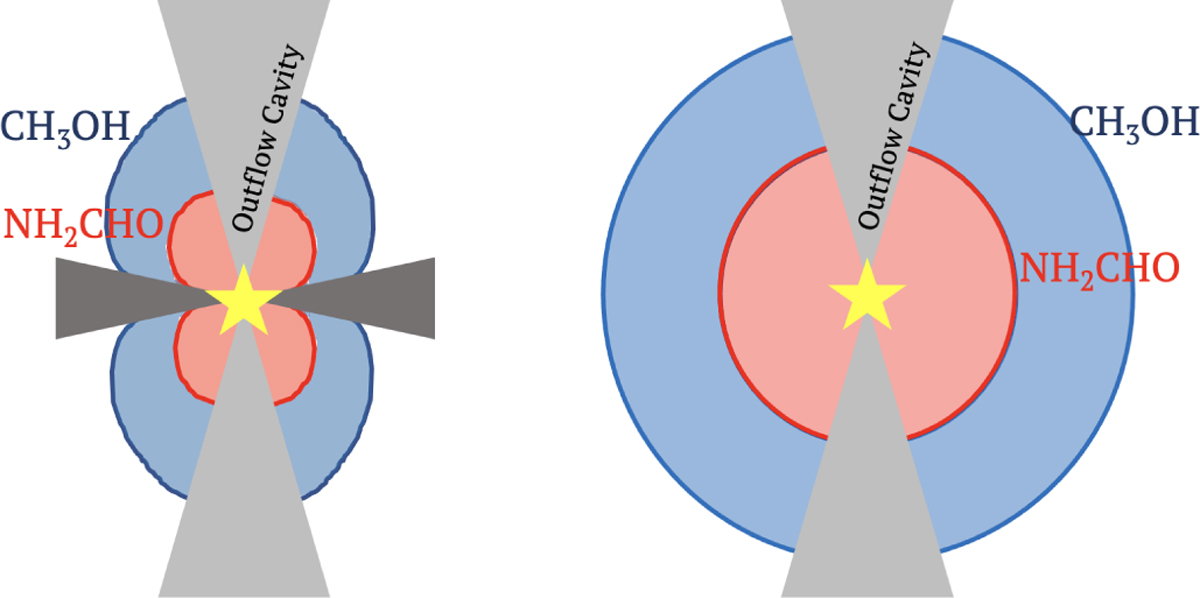
Cartoon of two sources: one with disk (left) and one without (right). The red and blue regions show the emitting regions of NH2CHO and CH3OH, respectively. There is not a priory reason as to why the ratio of the two sublimation regions between the two sources should remain constant.
Current usage metrics show cumulative count of Article Views (full-text article views including HTML views, PDF and ePub downloads, according to the available data) and Abstracts Views on Vision4Press platform.
Data correspond to usage on the plateform after 2015. The current usage metrics is available 48-96 hours after online publication and is updated daily on week days.
Initial download of the metrics may take a while.