Open Access
Fig. 1
Download original image
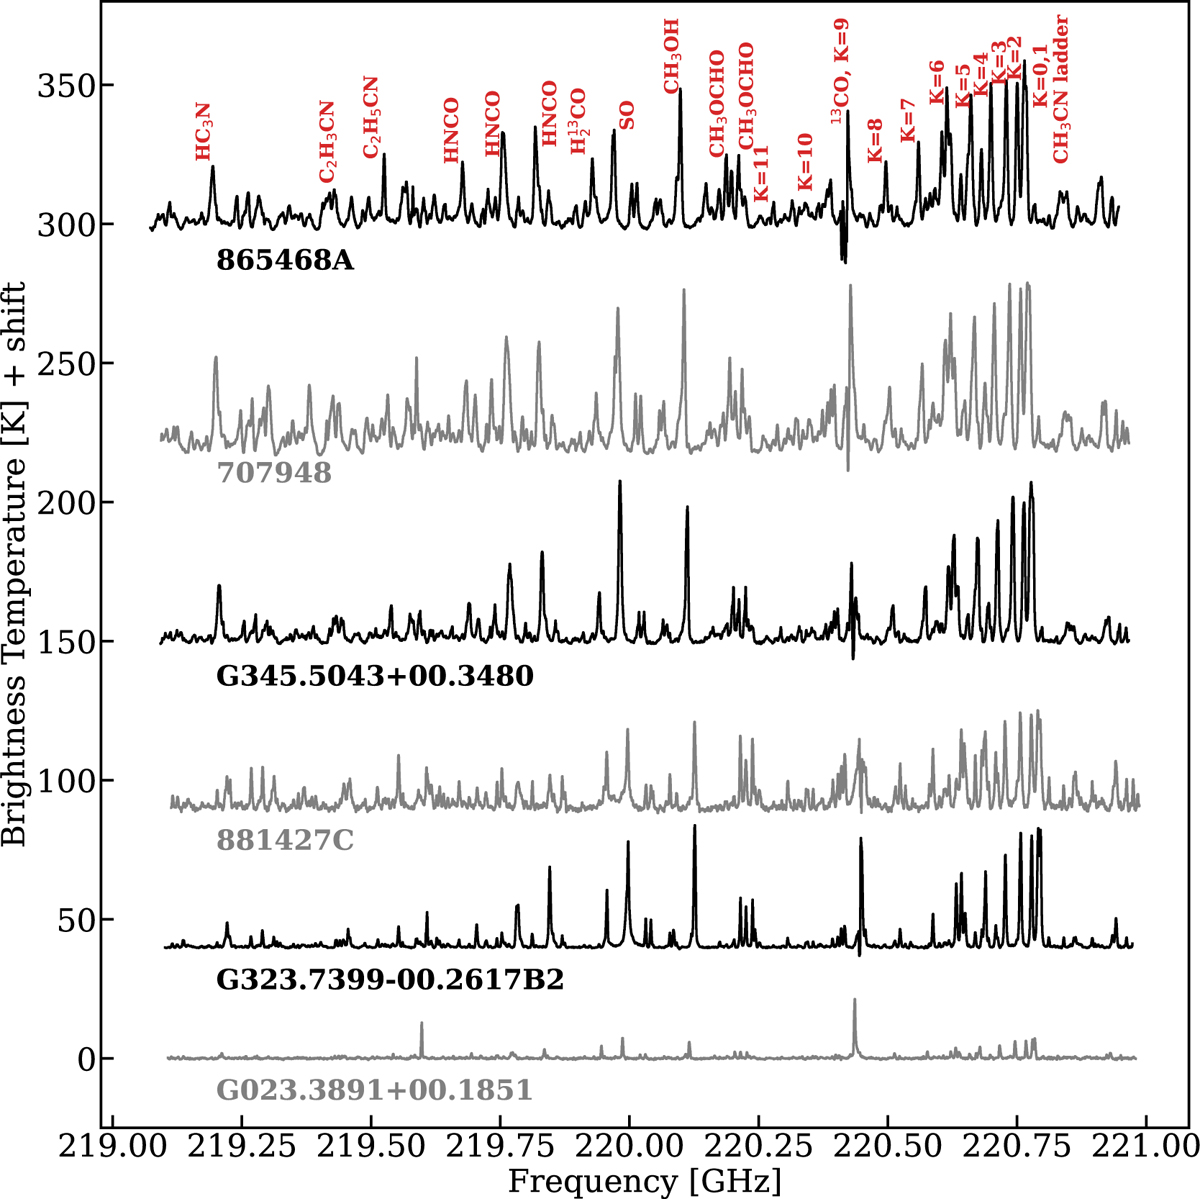
Spectra for six of the sources studied here with the name of each object printed below each spectrum. The molecules associated with several lines are also stated in red next to the lines.
Current usage metrics show cumulative count of Article Views (full-text article views including HTML views, PDF and ePub downloads, according to the available data) and Abstracts Views on Vision4Press platform.
Data correspond to usage on the plateform after 2015. The current usage metrics is available 48-96 hours after online publication and is updated daily on week days.
Initial download of the metrics may take a while.