Fig. 7
Download original image
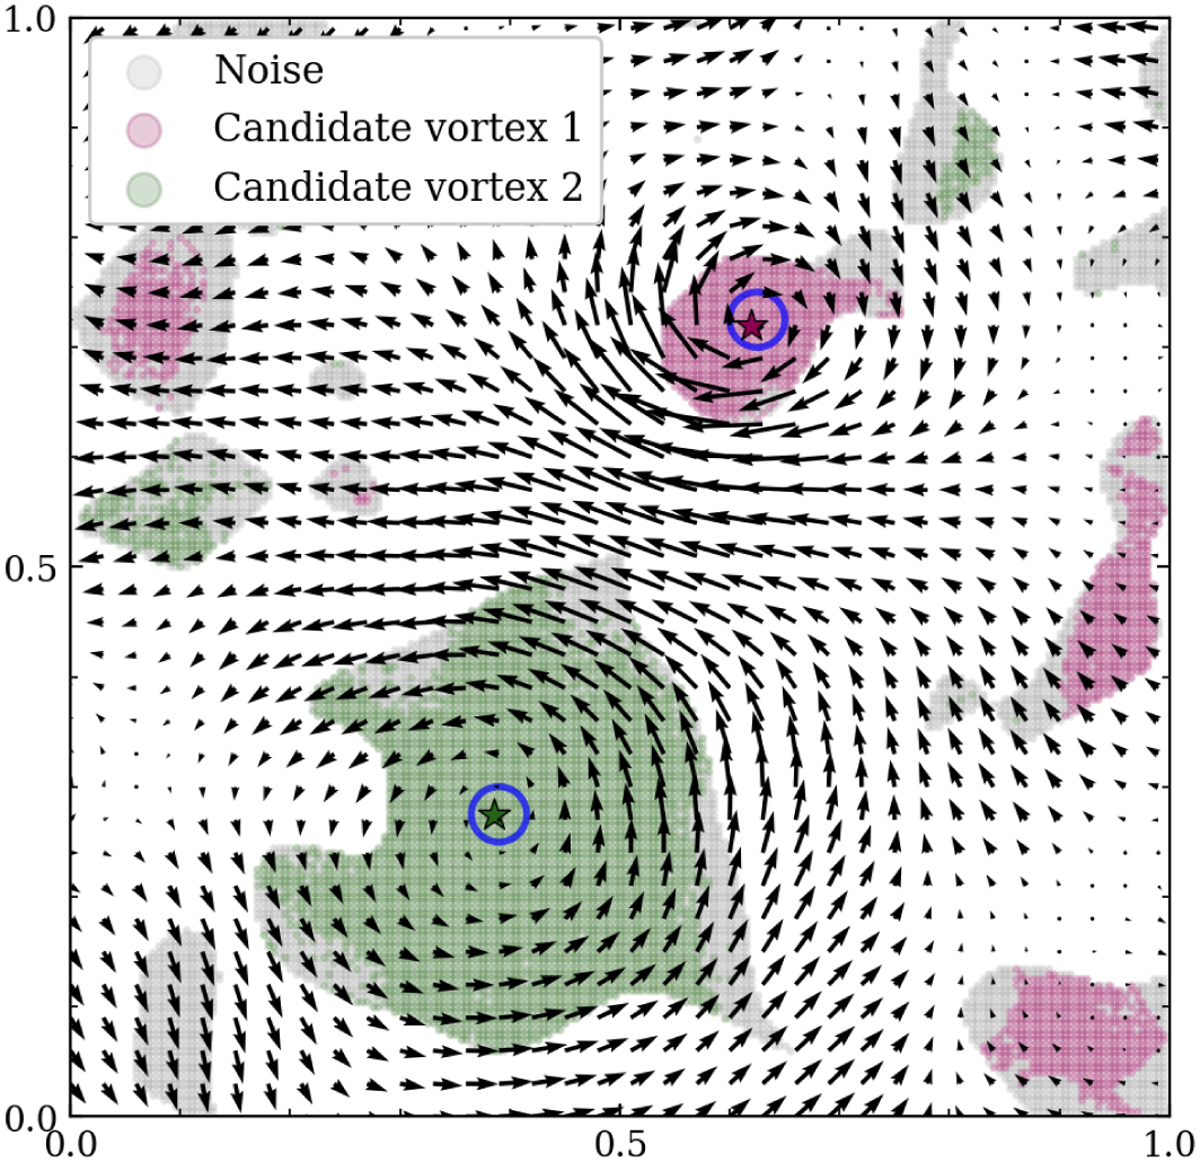
Groups of grid cells of candidate vortices (green and pink pixels) obtained by applying the grid-adapted CFSFDP algorithm to the G-EVC map of the artificial flow shown in Fig. 5. The cluster centers are marked with a star, while the blue circles show the approximate location of the two Lamb–Oseen vortex centers. Noisy grid cells are gray shaded.
Current usage metrics show cumulative count of Article Views (full-text article views including HTML views, PDF and ePub downloads, according to the available data) and Abstracts Views on Vision4Press platform.
Data correspond to usage on the plateform after 2015. The current usage metrics is available 48-96 hours after online publication and is updated daily on week days.
Initial download of the metrics may take a while.