Fig. 6
Download original image
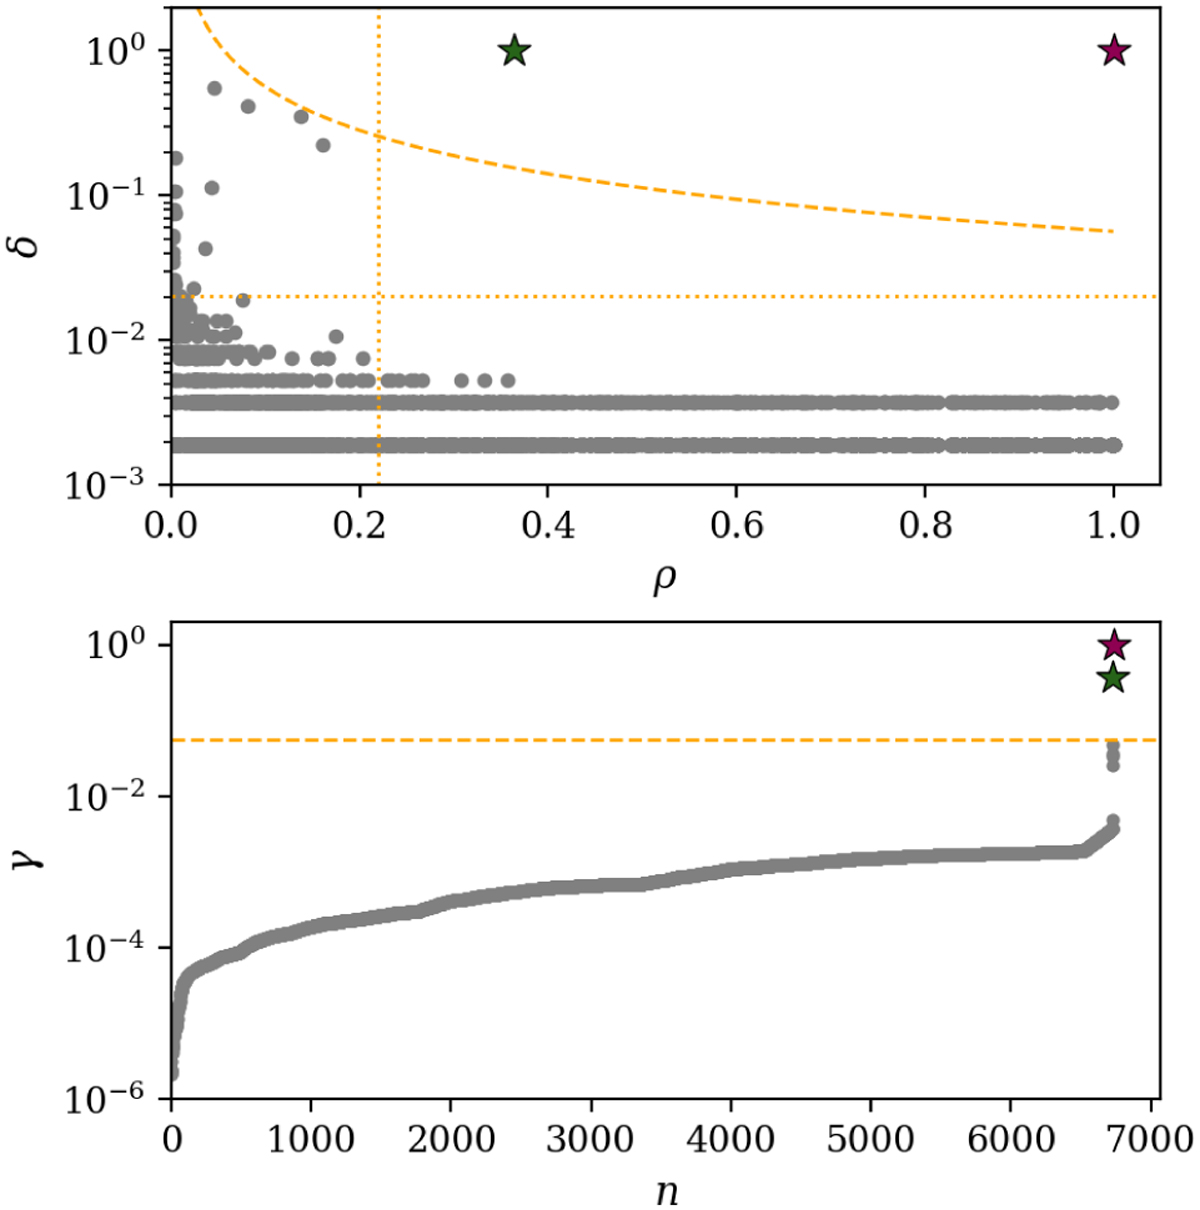
Decision graphs for the artificial Lamb–Oseen vortex flow of Fig. 5 based on the ρ − δ thresholds of Eq. (22), (top) and on the γ threshold of Eq. (23), (bottom). In the bottom panel, n represents the datapoint number in increasing order of γ. Dotted lines represent the ρ and δ thresholds, while dashed lines show the γ threshold. Each point corresponds to a EVC. The green and pink starred EVCs satisfy both thresholds and are therefore selected as cluster centers.
Current usage metrics show cumulative count of Article Views (full-text article views including HTML views, PDF and ePub downloads, according to the available data) and Abstracts Views on Vision4Press platform.
Data correspond to usage on the plateform after 2015. The current usage metrics is available 48-96 hours after online publication and is updated daily on week days.
Initial download of the metrics may take a while.