Fig. 5
Download original image
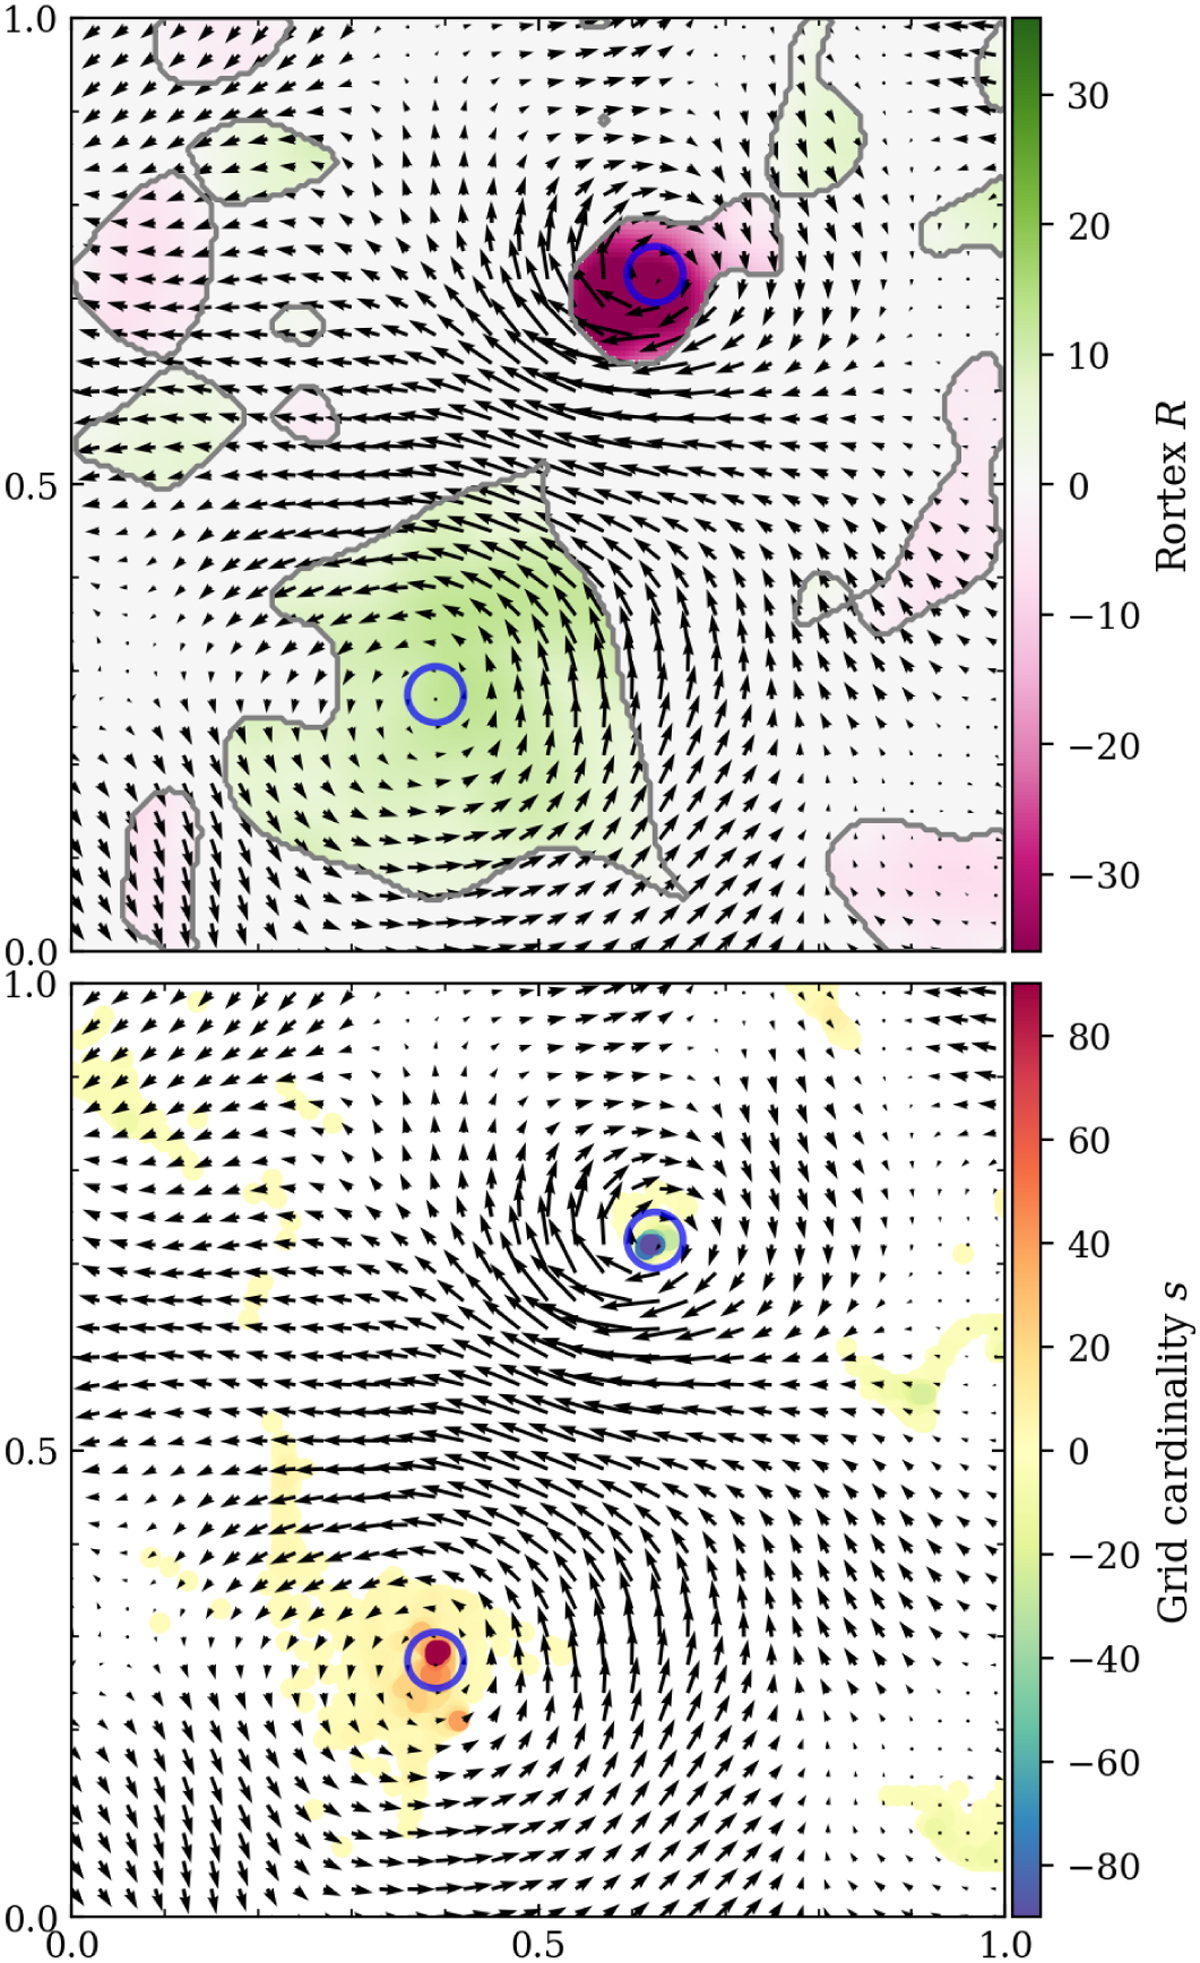
Application of the grid-adapted EVC method to an artificial flow composed of two Lamb–Oseen vortices of opposite orientation superposed by a Gaussian noise signal. Top panel: Rortex map. Bottom panel: G-EVC map. The cardinality s accounts for the number of EVC points which coordinates fall in the same grid cell. The blue circles show the approximate location of the two vortex centers. The regions where R ≠ 0 are outlined by a gray contour in the Rortex map.
Current usage metrics show cumulative count of Article Views (full-text article views including HTML views, PDF and ePub downloads, according to the available data) and Abstracts Views on Vision4Press platform.
Data correspond to usage on the plateform after 2015. The current usage metrics is available 48-96 hours after online publication and is updated daily on week days.
Initial download of the metrics may take a while.