Fig. 10
Download original image
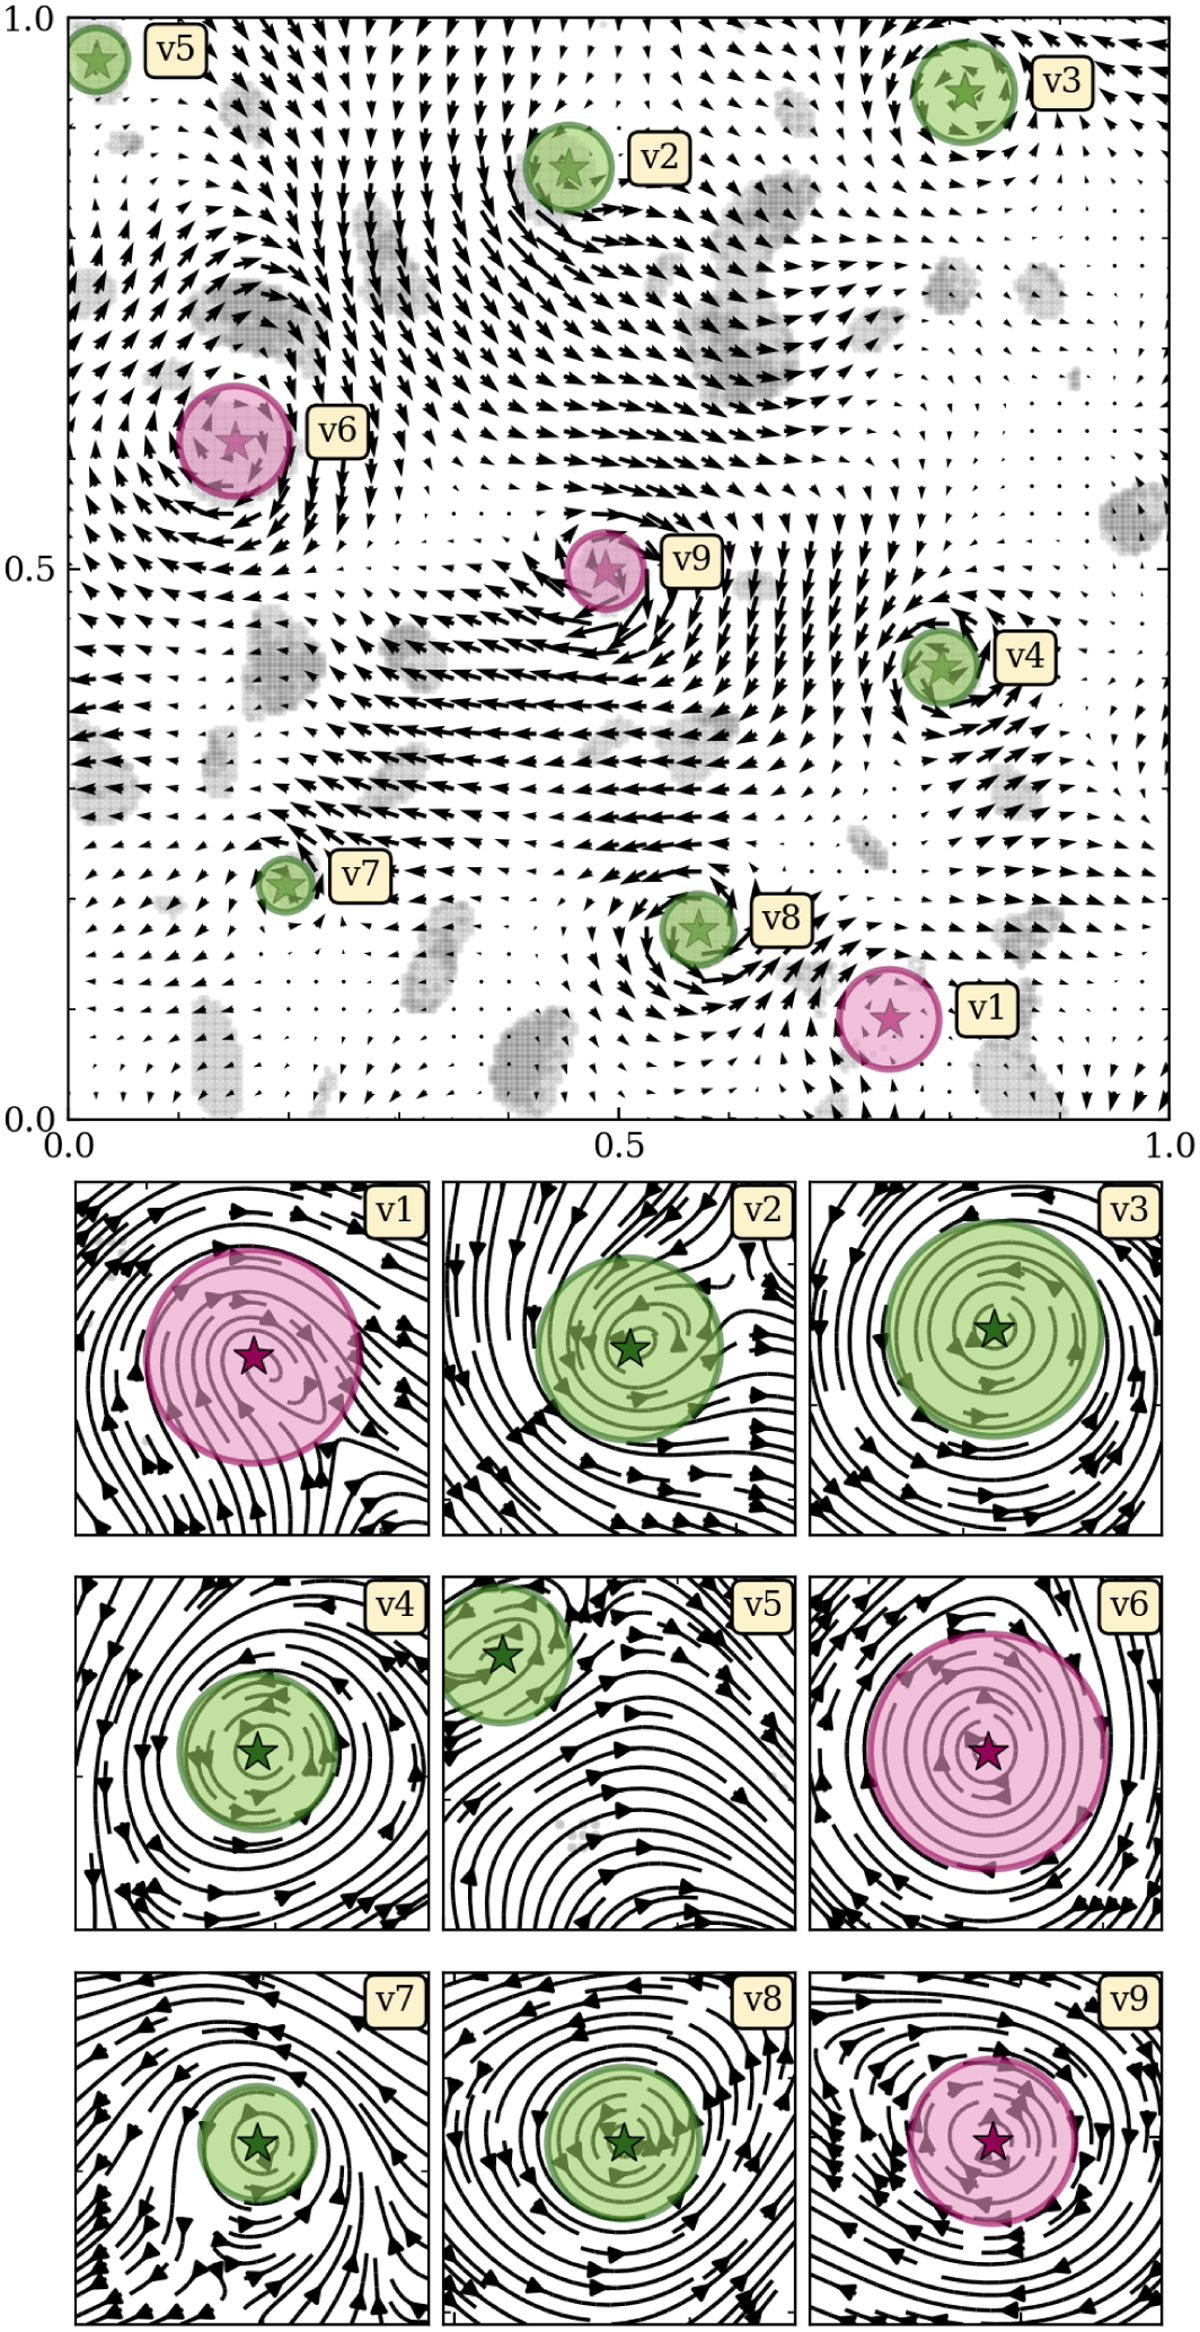
Identified vortices in the artificial flow of Fig. 9. Top panel: position and the size of nine identified vortices. Green colored vortices rotate counter-clockwise, the pink ones rotate clockwise. The velocity field is displayed by a vector plot. Grid cells labeled as noise are shown in gray. Bottom panels: close-ups on the different vortices. The velocity field is represented by streamlines. Stars denote the center of the vortices and the radii are computed according to Eq. (24).
Current usage metrics show cumulative count of Article Views (full-text article views including HTML views, PDF and ePub downloads, according to the available data) and Abstracts Views on Vision4Press platform.
Data correspond to usage on the plateform after 2015. The current usage metrics is available 48-96 hours after online publication and is updated daily on week days.
Initial download of the metrics may take a while.