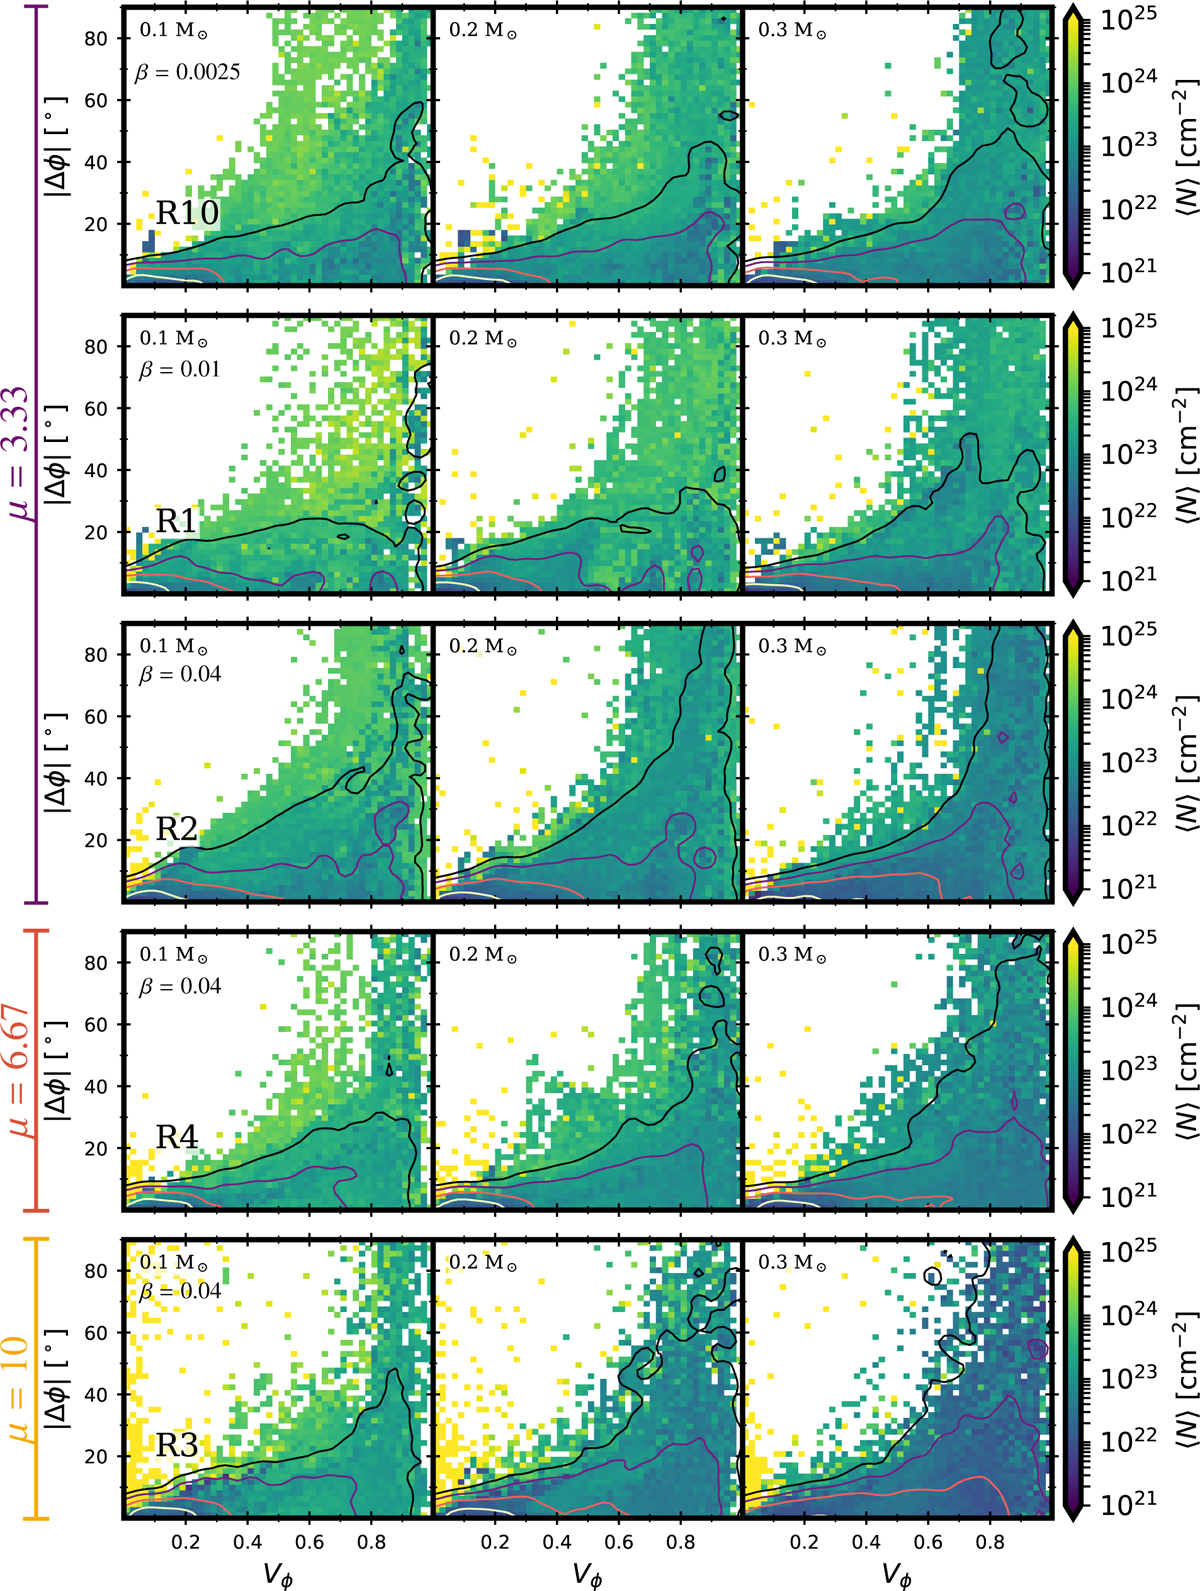
Fig. A.10
Download original image
Distribution of the discrepancy between the B angle inferred from the synthetic polarized dust emission at λ = 3.0 mm and the mean orientation of the B lines in the simulation as a function of the circular variance Vϕ for the simulations with standard conditions. All these simulations do not include any initial turbulence (M = 0) and have an initial inclination angle between the initial rotation axis and the magnetic field θ of 30°. The contour lines show the smoothed 2D histogram contour levels at 105 (yellow), 104 (red), 103 (purple), and 102 (black) counts. The color coded background corresponds to the mean column density.
Current usage metrics show cumulative count of Article Views (full-text article views including HTML views, PDF and ePub downloads, according to the available data) and Abstracts Views on Vision4Press platform.
Data correspond to usage on the plateform after 2015. The current usage metrics is available 48-96 hours after online publication and is updated daily on week days.
Initial download of the metrics may take a while.