Fig. 10
Download original image
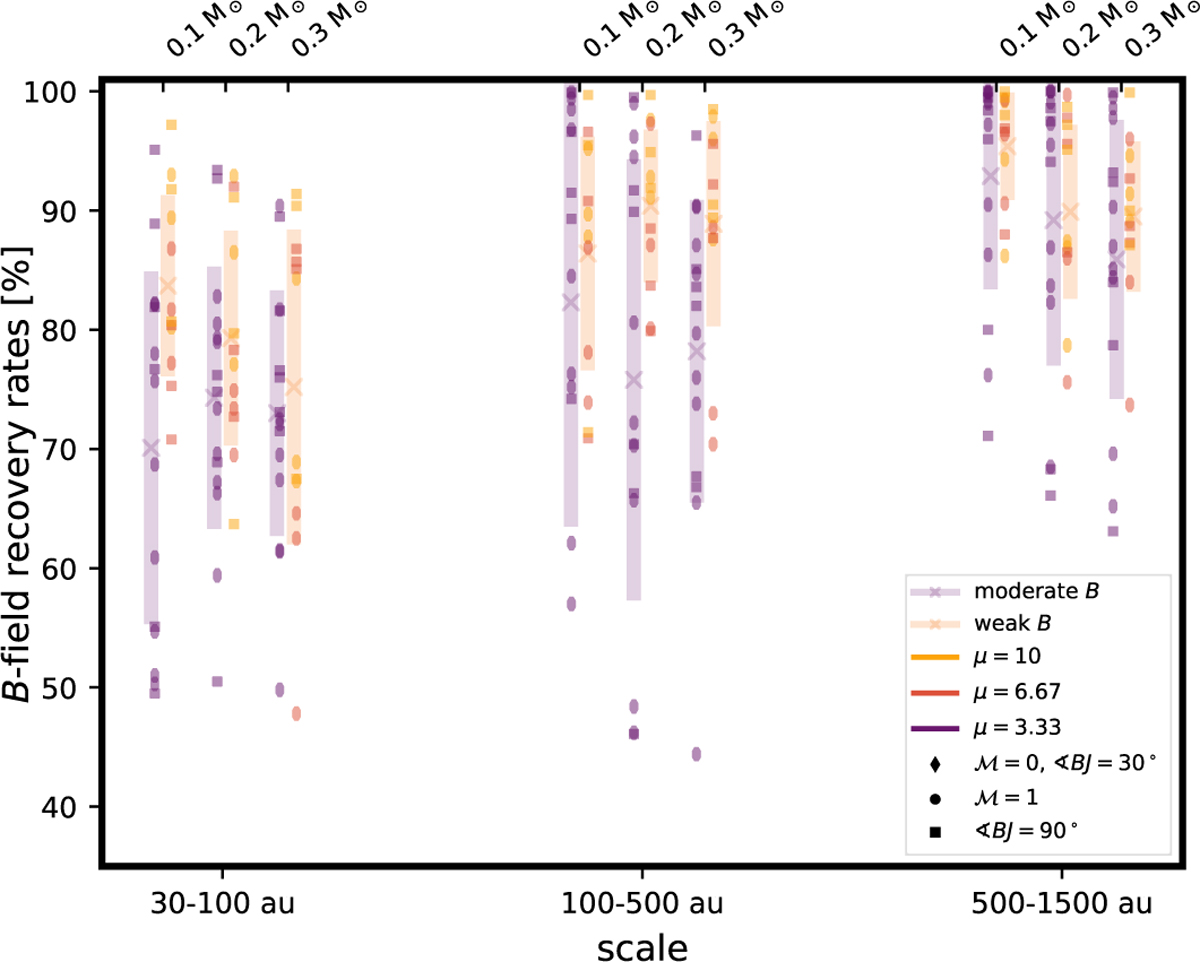
B-field recovery rate for all the synthetic observations at λ = 0.8 mm. Individual points correspond to those of Table A.1, while the cross symbols and vertical bars correspond to the averaged values and their standard variation for the two cases defined in Table 3, respectively: moderate (μ = 3.33) and weak (μ > 6) magnetic fields. The values are separated in three spatial scales (indicated at the bottom of the figure), and slightly shifted for the sake of clarity for the three evolutionary stages given by the protostellar mass indicated at the top of the figure.
Current usage metrics show cumulative count of Article Views (full-text article views including HTML views, PDF and ePub downloads, according to the available data) and Abstracts Views on Vision4Press platform.
Data correspond to usage on the plateform after 2015. The current usage metrics is available 48-96 hours after online publication and is updated daily on week days.
Initial download of the metrics may take a while.