Fig. 6.
Download original image
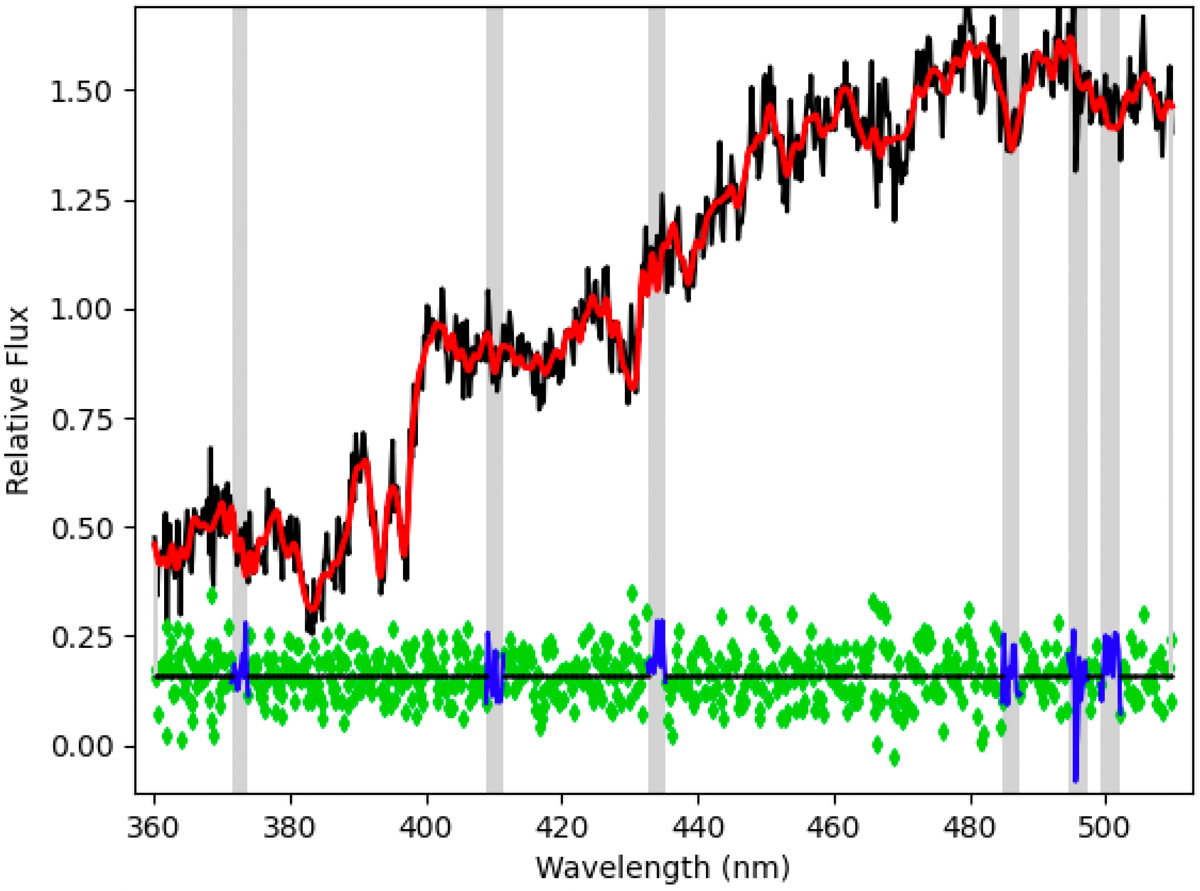
Example of spectral fitting with pPXF for one resolution element in our binned data cube (the central bin in Fig. 5). The black and red lines show the observed spectrum normalized to unity and the best-fit stellar template, respectively. The green symbols at the bottom are the fit residuals, and the blue lines with gray-shaded regions show positions of gas emission lines masked during the fit. The most prominent spectral features used for the fit are the Ca H and K lines at 3935 Å and 3970 Å in the rest frame, the continuum break at 4000 Å, the G-band feature at 4305 Å, and the Hβ line at 4863 Å. Such high-S/N spectra are used to extract robust stellar kinematics for the BGG out to ≃0.5 Reff (see Fig. 5).
Current usage metrics show cumulative count of Article Views (full-text article views including HTML views, PDF and ePub downloads, according to the available data) and Abstracts Views on Vision4Press platform.
Data correspond to usage on the plateform after 2015. The current usage metrics is available 48-96 hours after online publication and is updated daily on week days.
Initial download of the metrics may take a while.