Fig. 3.
Download original image
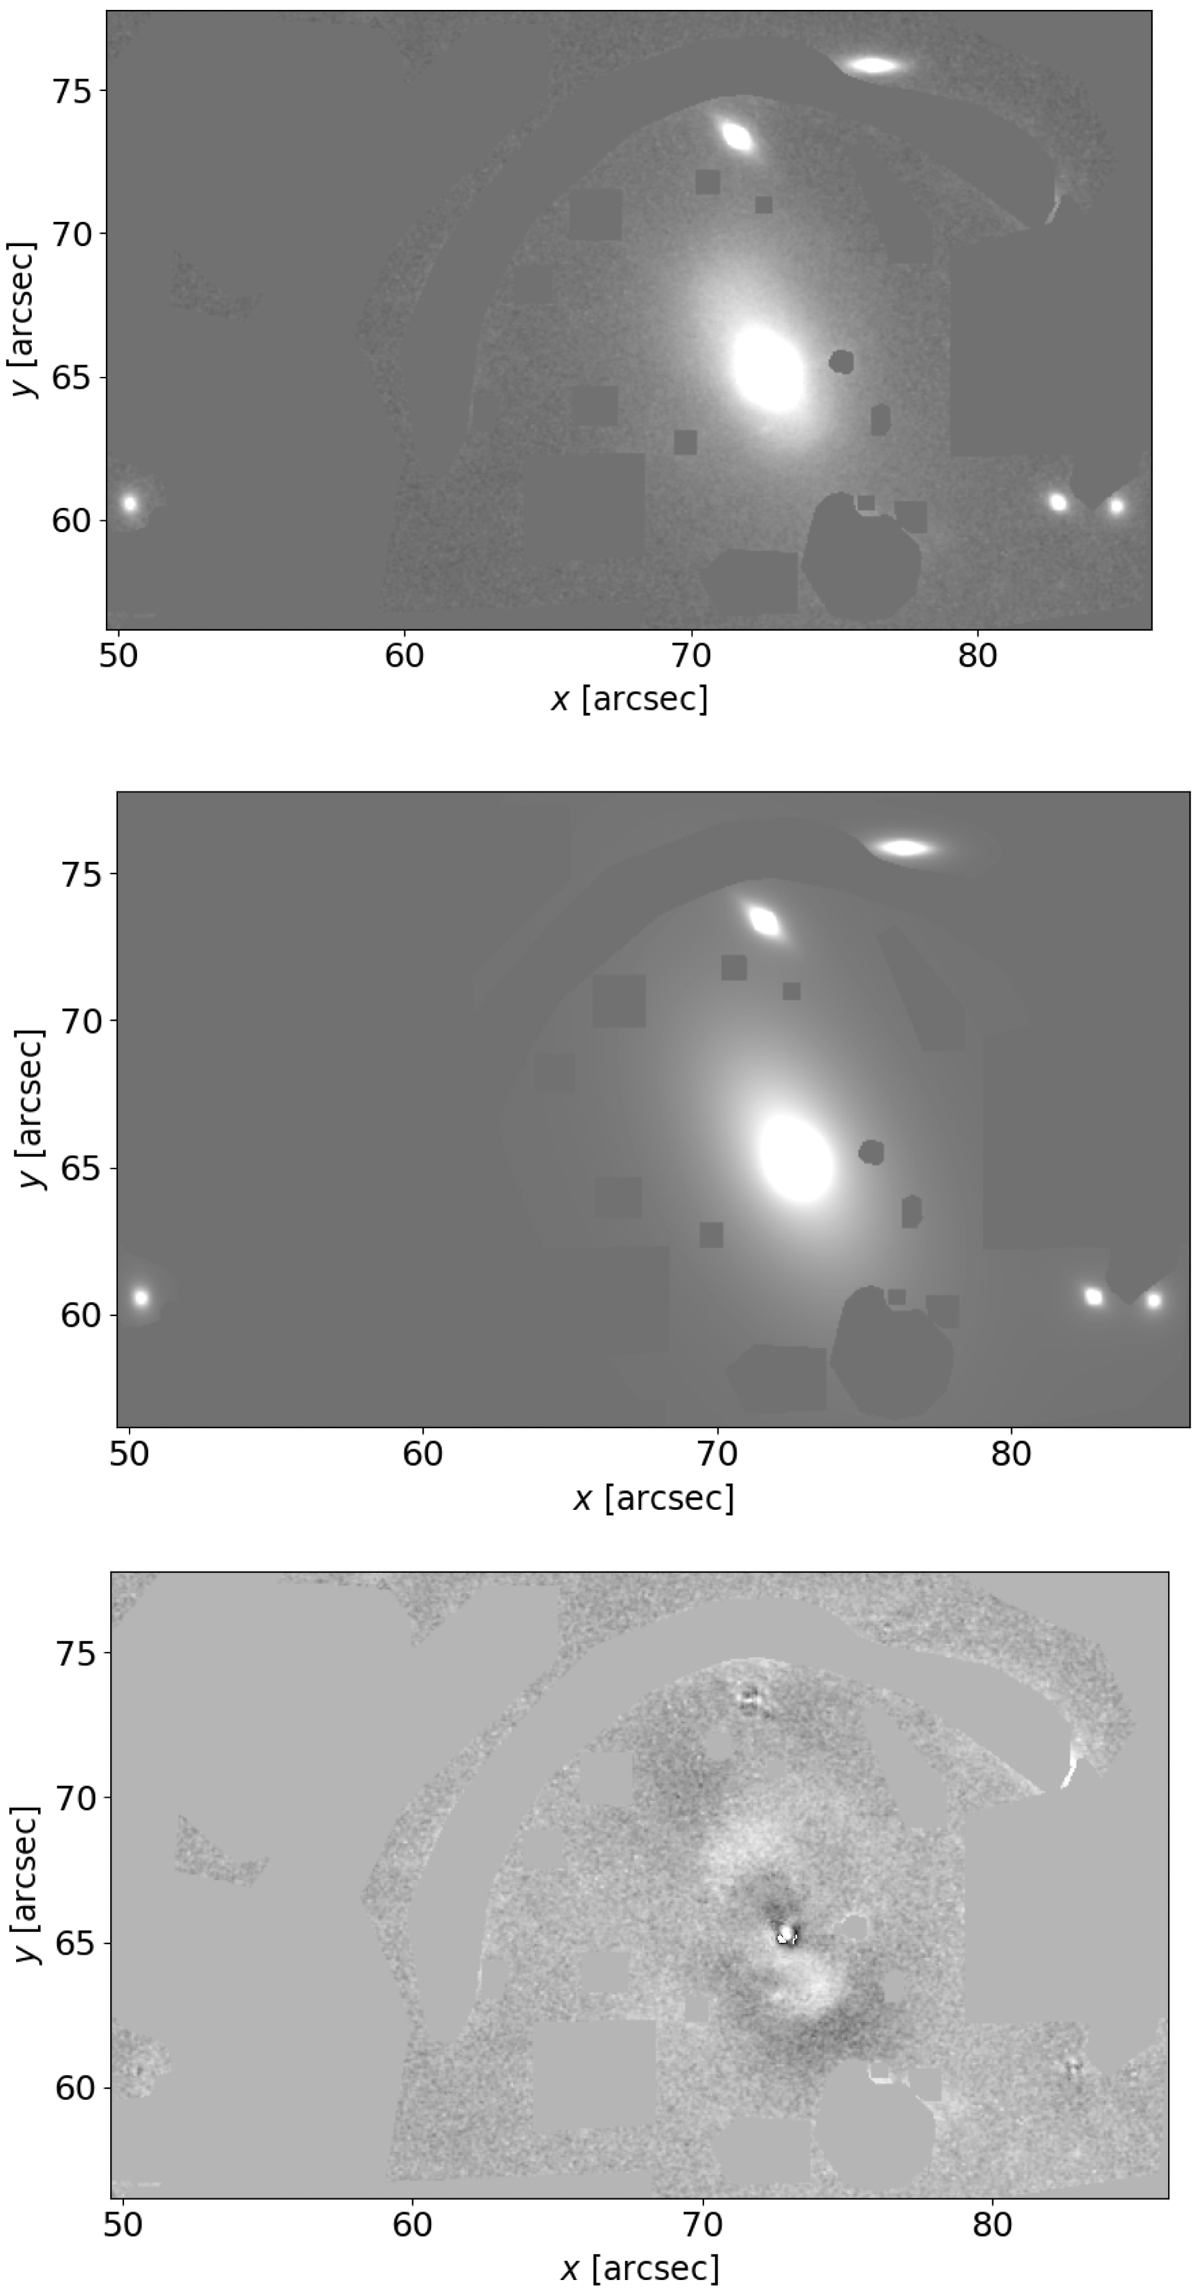
Best-fit model for the light distribution of the BGG and five nearby group members. From top to bottom: observed HST F160W band image, the best-fit model, and the normalized residuals in the range −7σ to 7σ. In all three images, the constant areas are the masks covering the lensed arcs and other objects in the field. The panels cover a field of view of 36″ × 22″ and are oriented in the same way as in Fig. 1, with north approximately toward the bottom.
Current usage metrics show cumulative count of Article Views (full-text article views including HTML views, PDF and ePub downloads, according to the available data) and Abstracts Views on Vision4Press platform.
Data correspond to usage on the plateform after 2015. The current usage metrics is available 48-96 hours after online publication and is updated daily on week days.
Initial download of the metrics may take a while.