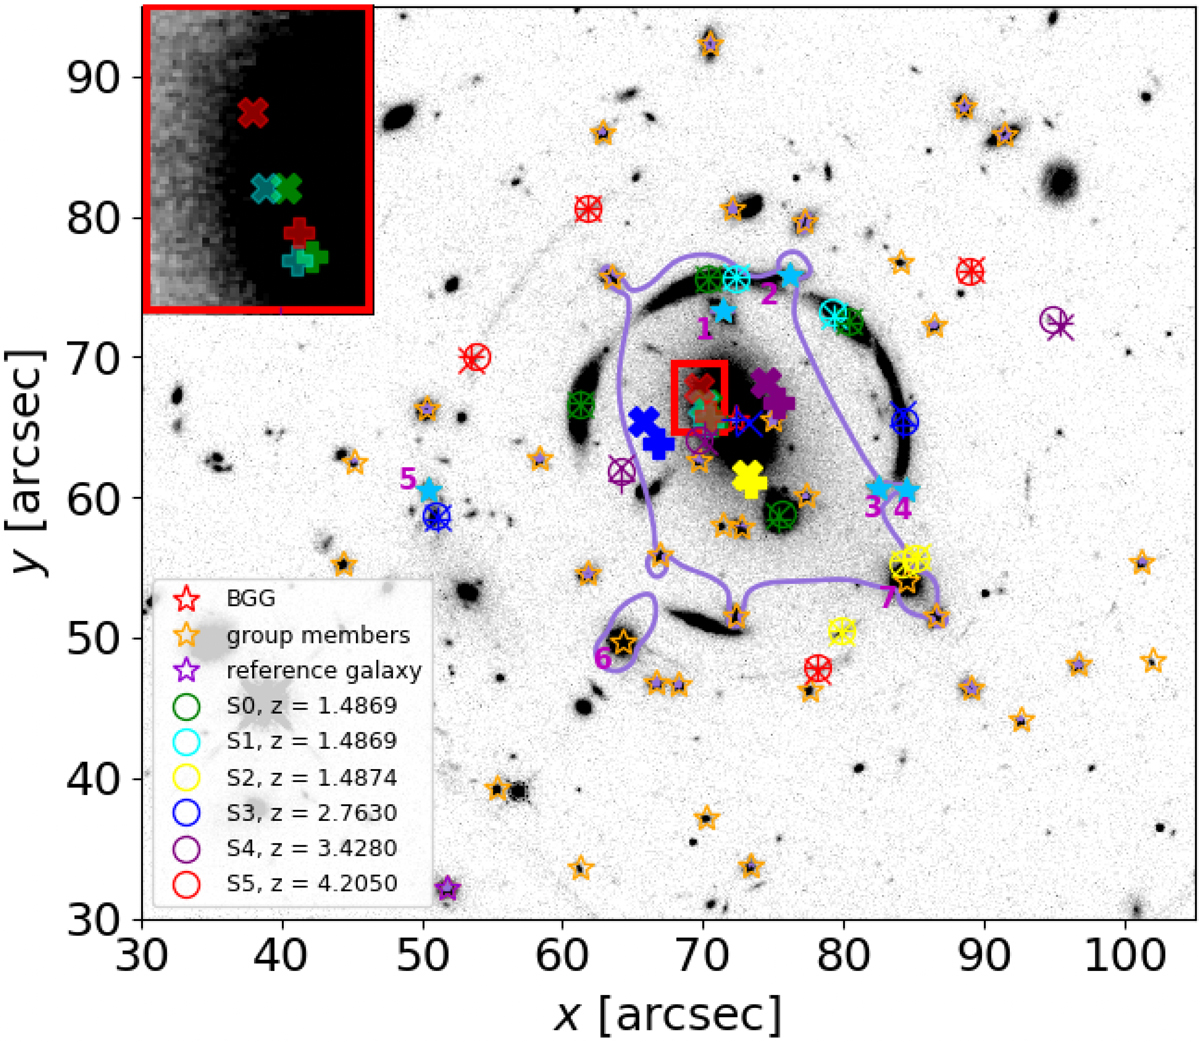
Fig. 2.

Download original image
HST F160W image showing the BGG (red star), group members (orange stars), the reference galaxy used in the scaling relations (purple star), and sets of multiple images (circles). We modeled the emission of group members 1, 2, 3, 4, and 5 (cyan filled stars) together with the BGG in order to minimize light contamination on the nearby lensed arcs. Given the significant contribution of group members 1, 2, 6, and 7 to the light deflection angles, their Einstein radius were optimized separately. The image positions predicted by models Img-SP (L) and Img-MP (L) are marked by plus and cross symbols, respectively. Similarly, the mean weighted source positions reconstructed by models Img-SP (L) and Img-MP (L) are indicated with bold plus and cross symbols, respectively. The solid purple line shows the critical curve of model Img-SP (L) with regards to S0. The upper-left inset zooms in on the 3.6″ × 4.9″ rectangle to highlight the intrinsic positions of S0, S1, and S5 in both models. The solid purple line shows the critical curve of model Img-MP(L) for z = 1.487, the redshift of S0. The critical curves of other reference models are shown in Appendix E.
Current usage metrics show cumulative count of Article Views (full-text article views including HTML views, PDF and ePub downloads, according to the available data) and Abstracts Views on Vision4Press platform.
Data correspond to usage on the plateform after 2015. The current usage metrics is available 48-96 hours after online publication and is updated daily on week days.
Initial download of the metrics may take a while.


