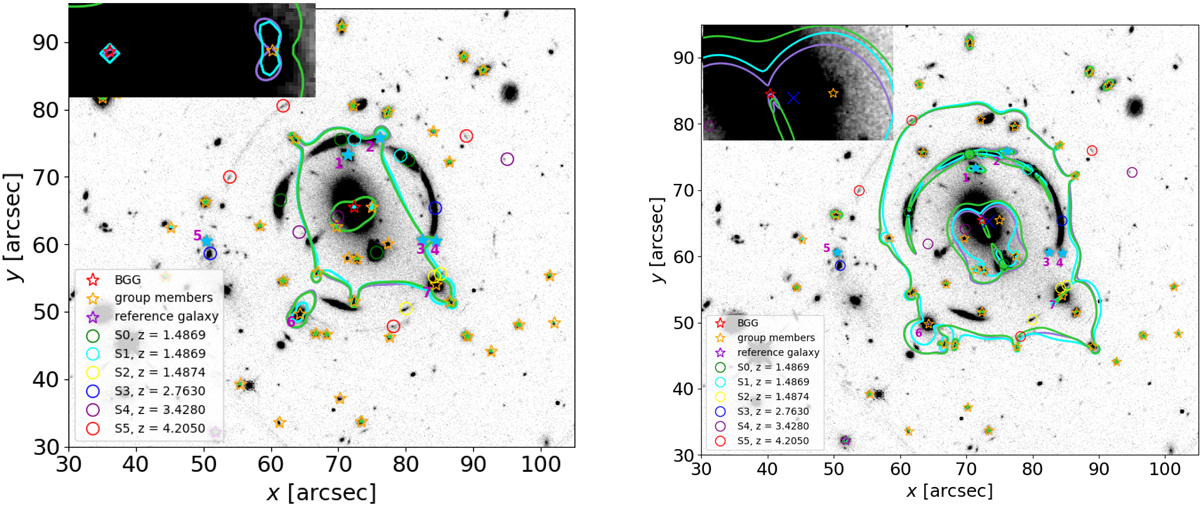
Fig. E.1.
Download original image
Critical curves of three reference lens models. Left: Critical curves for models Img-MP (L) (solid purple line), Esr2-MPtest (L) (solid cyan line), and Img-MP (L/D) (solid green line), and for the redshift of S0. The upper-left inset zooms in on a 5″ × 3″ rectangle to show more details of critical curves in the central region. Right: Same critical curves but for the redshift of S3. The upper-left inset zooms in on an 8″ × 5″ rectangle around the central region where the third image of S3 falls (blue “cross”). No critical curves pass through S3(b), the extended arc of S3, indicating that it comprises a single distorted image.
Current usage metrics show cumulative count of Article Views (full-text article views including HTML views, PDF and ePub downloads, according to the available data) and Abstracts Views on Vision4Press platform.
Data correspond to usage on the plateform after 2015. The current usage metrics is available 48-96 hours after online publication and is updated daily on week days.
Initial download of the metrics may take a while.