Fig. B.1.
Download original image
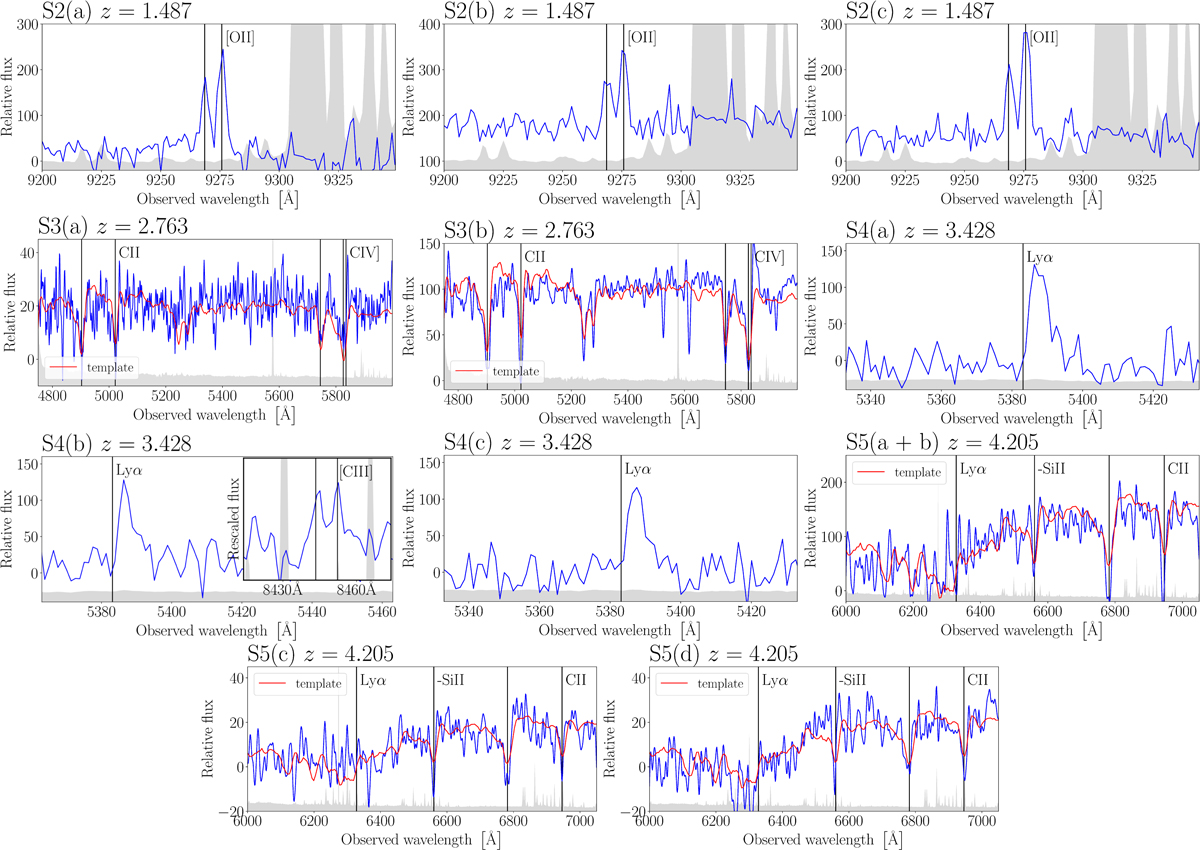
MUSE 1D spectra of the multiple images in sets S2, S3, S4, and S5, which are newly confirmed. The blue lines are the observed spectra in units of 10−20 erg s−1 cm−2 Å−1. They are extracted using circular apertures of 0.8″ radii, except for the faint images S5(a) and S5(b), which are jointly extracted along the extended arc. The gray regions indicate the data variance. The vertical lines mark the main spectral features used to measure redshifts, and the red curves show the best-fit templates used to estimate the redshifts of images in sets S3 and S5. The best-fit systemic redshift reported for set S4 comes from the [CIII] emission line detected in image S4(b). Lyα lines are detected in all three images of S4 and are slightly redshifted (see also, e.g., Verhamme et al. 2018).
Current usage metrics show cumulative count of Article Views (full-text article views including HTML views, PDF and ePub downloads, according to the available data) and Abstracts Views on Vision4Press platform.
Data correspond to usage on the plateform after 2015. The current usage metrics is available 48-96 hours after online publication and is updated daily on week days.
Initial download of the metrics may take a while.