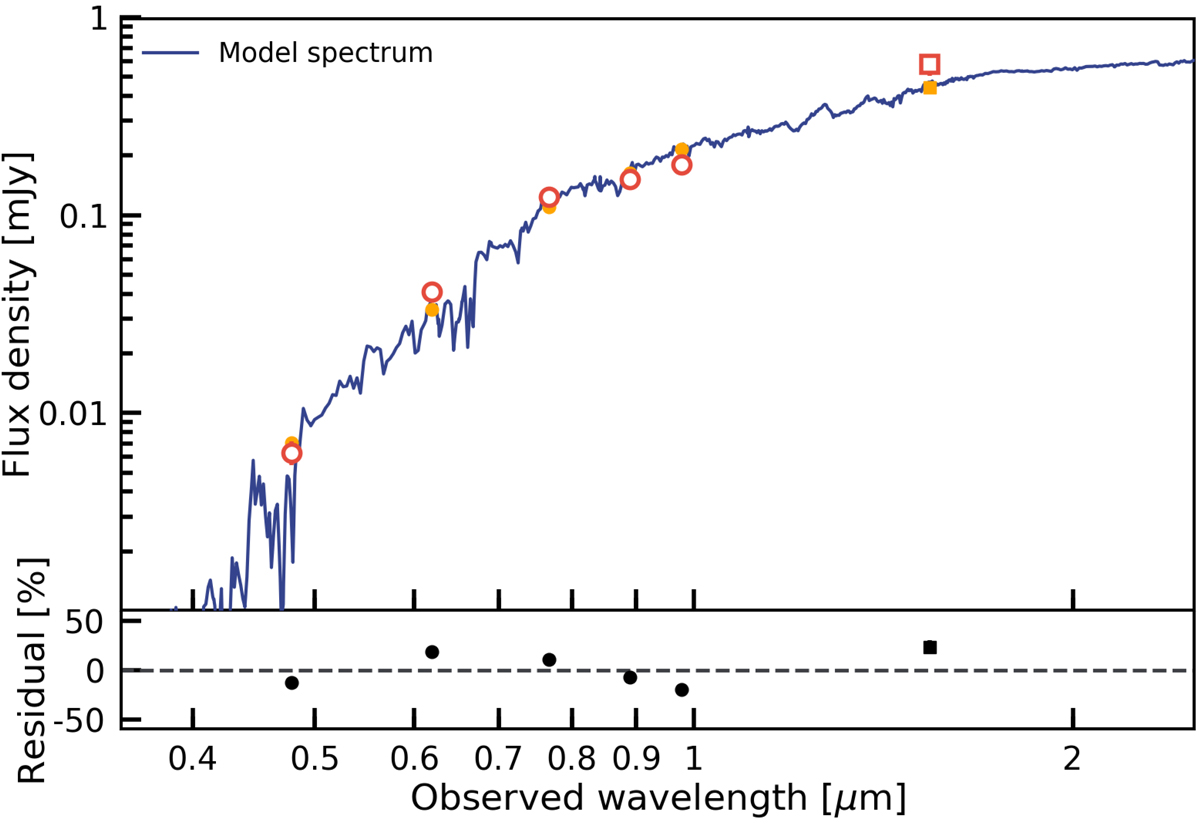
Fig. A.1.
Download original image
SED of the BGG in CSWA 31. The observed Pan-STARRS (red circles) and HST (red square) fluxes are plotted, with uncertainties smaller than the symbols, together with the best-fit SED obtained with CIGALE (blue curve) and the corresponding model fluxes (orange markers). The bottom panel shows the relative residuals of the fit.
Current usage metrics show cumulative count of Article Views (full-text article views including HTML views, PDF and ePub downloads, according to the available data) and Abstracts Views on Vision4Press platform.
Data correspond to usage on the plateform after 2015. The current usage metrics is available 48-96 hours after online publication and is updated daily on week days.
Initial download of the metrics may take a while.