Fig. 11.
Download original image
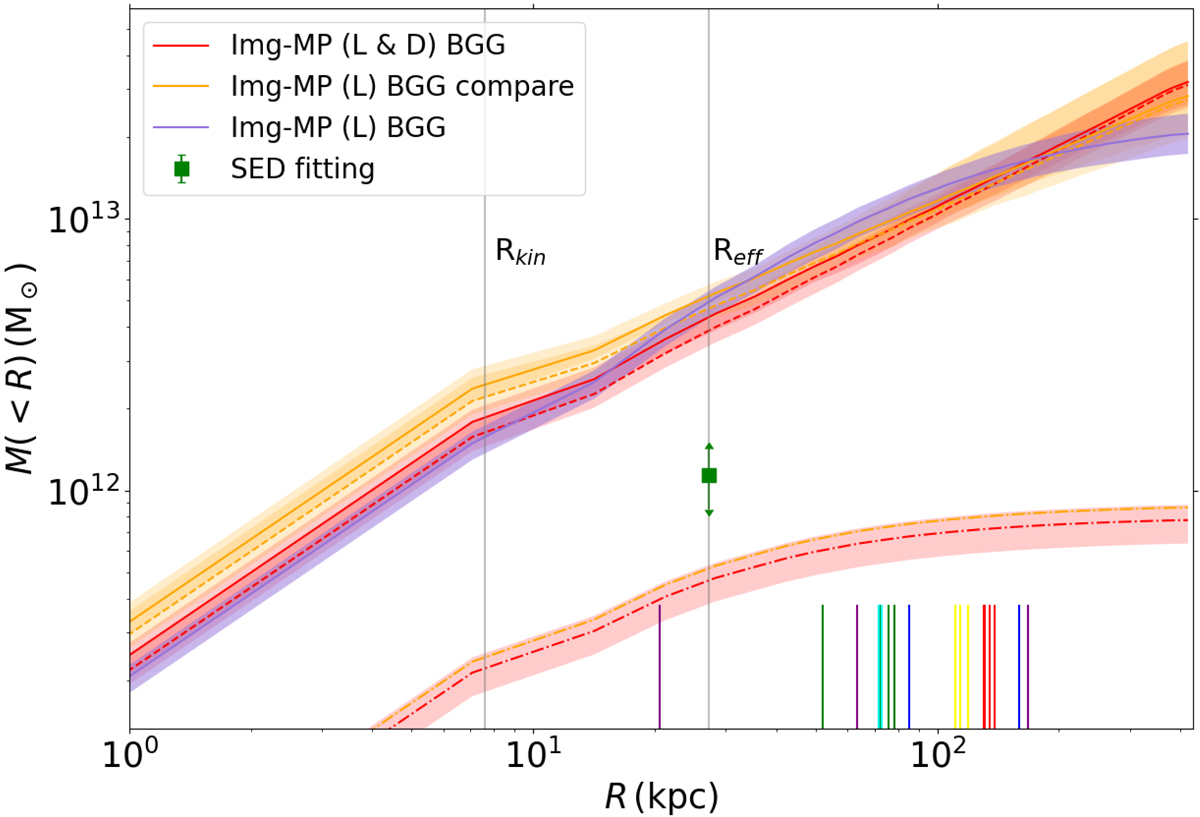
Decomposition of dark-matter and baryonic mass components within the BGG from model Img-MP (L&D). We plot the cumulative profiles for the dark-matter (dashed red line) and baryonic (dot-dashed red line) components, and for the total mass of the BGG (solid red line). The purple curve shows the total mass profile of the BGG obtained in model Img-MP (L) using a single dPIE. The orange lines show the decomposition of dark-matter (dashed orange line) and baryonic (dot-dashed orange line) mass components within the BGG, from an additional lensing-only model with the same mass configuration as Img-MP (L&D). The shaded regions show the 1σ uncertainties on the mass distributions estimated from the 16th and 84th percentiles of the posterior PDFs. The baryonic mass profile from Img-MP (L&D) is lower than the stellar mass at Reff inferred independently from SED fitting (green square), and this discrepancy is driven by lensing constraints rather than JAM modeling. Vertical lines at the bottom indicate the positions of the multiple images used as lensing constraints.
Current usage metrics show cumulative count of Article Views (full-text article views including HTML views, PDF and ePub downloads, according to the available data) and Abstracts Views on Vision4Press platform.
Data correspond to usage on the plateform after 2015. The current usage metrics is available 48-96 hours after online publication and is updated daily on week days.
Initial download of the metrics may take a while.