Fig. 1.
Download original image
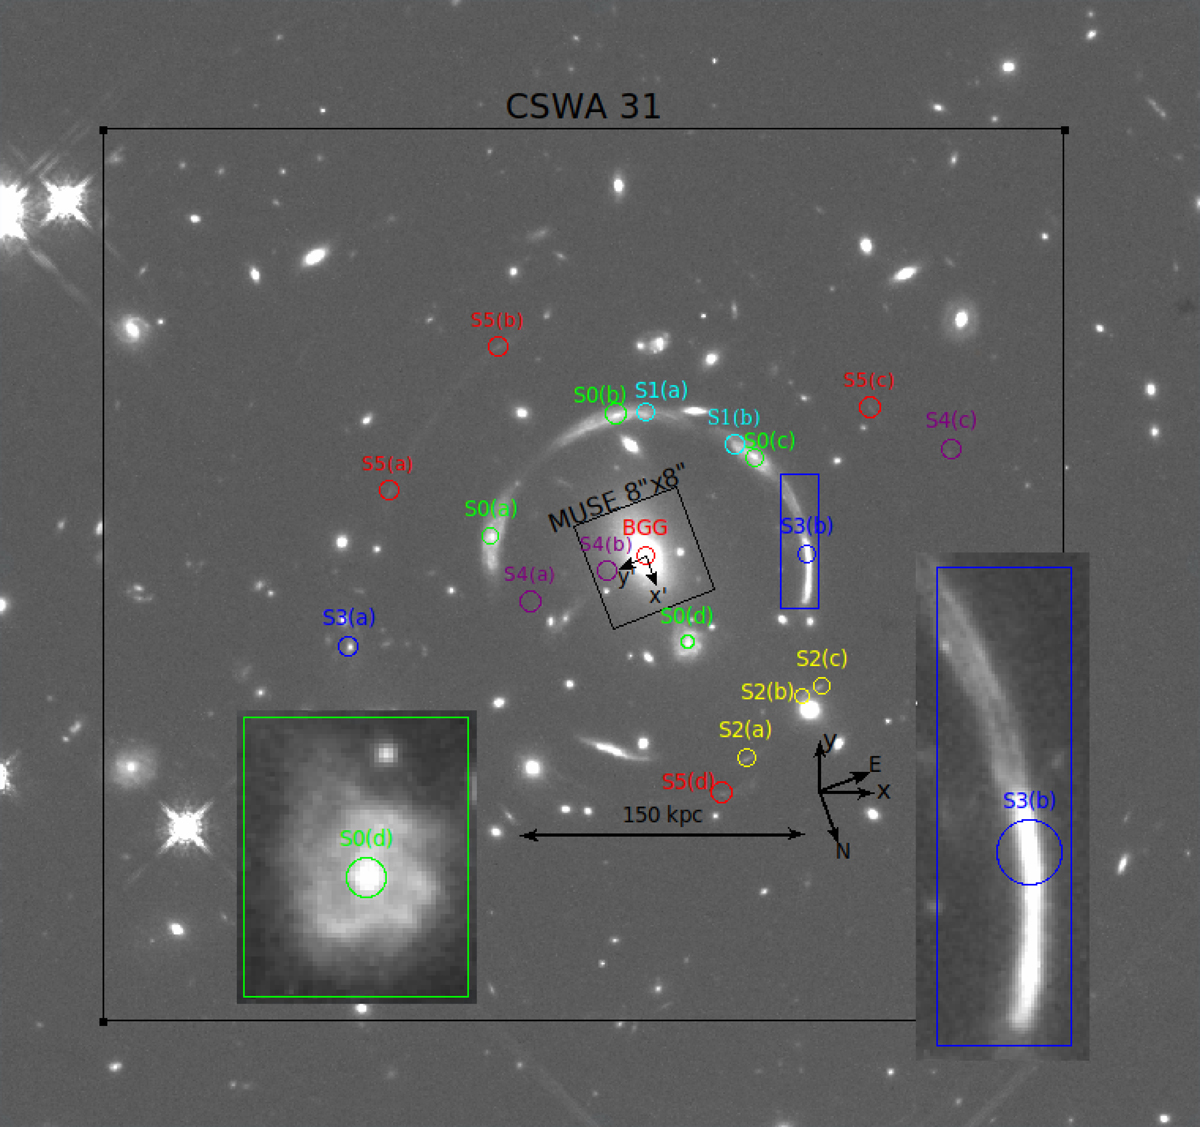
HST/WFC3 image of CSWA 31 and its surrounding environment in the F160W band. The orientation is marked by the black arrows in the bottom-right of the figure, and the ruler indicates a physical scale of 150 kpc in the main lens plane at z = 0.683. The large black box marks the total 1′ × 1′ coverage of MUSE observations. The small 8″ × 8″ black box in the center shows the field of view considered for the dynamical analysis of the main lens galaxy, and the x′ and y′ arrows show the orientation adopted for the kinematic maps (see Sect. 5). The sets of spectroscopically confirmed multiple images used in our analysis are marked with circles, with a different color for each set. The image sets S0 and S1 are bright knots from the same spiral galaxy at z = 1.4869, with a zoomed-in image of S0(d) in the left inset. The right inset shows the bright arc from source galaxy S3 at z = 2.763. The multiple images of source 4 (S4) are identified with MUSE and undetected in this HST image.
Current usage metrics show cumulative count of Article Views (full-text article views including HTML views, PDF and ePub downloads, according to the available data) and Abstracts Views on Vision4Press platform.
Data correspond to usage on the plateform after 2015. The current usage metrics is available 48-96 hours after online publication and is updated daily on week days.
Initial download of the metrics may take a while.