Fig. 3
Download original image
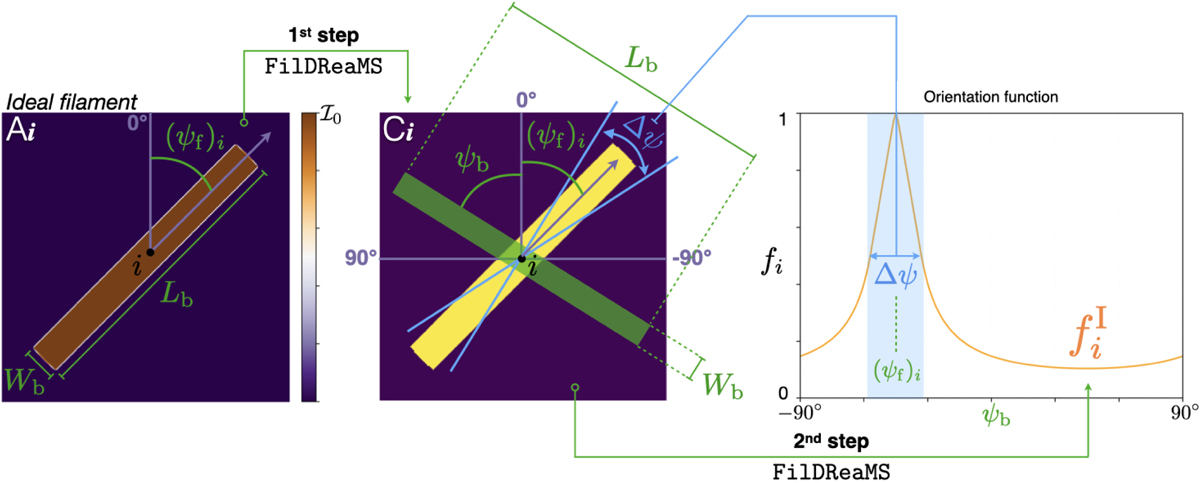
Illustration of one ideal filament and its ideal orientation function. Left: map of an ideal filament (filament with the exact same shape as the model bar) centered on pixel i and oriented at angle (ψf)i (here (ψf)i < 0). Middle: corresponding binary map, with the model bar overplotted in green. Right: ideal orientation function, ![]() from the second step of FilDReaMS applied to the binary map.
from the second step of FilDReaMS applied to the binary map.
Current usage metrics show cumulative count of Article Views (full-text article views including HTML views, PDF and ePub downloads, according to the available data) and Abstracts Views on Vision4Press platform.
Data correspond to usage on the plateform after 2015. The current usage metrics is available 48-96 hours after online publication and is updated daily on week days.
Initial download of the metrics may take a while.