Fig. 2

Download original image
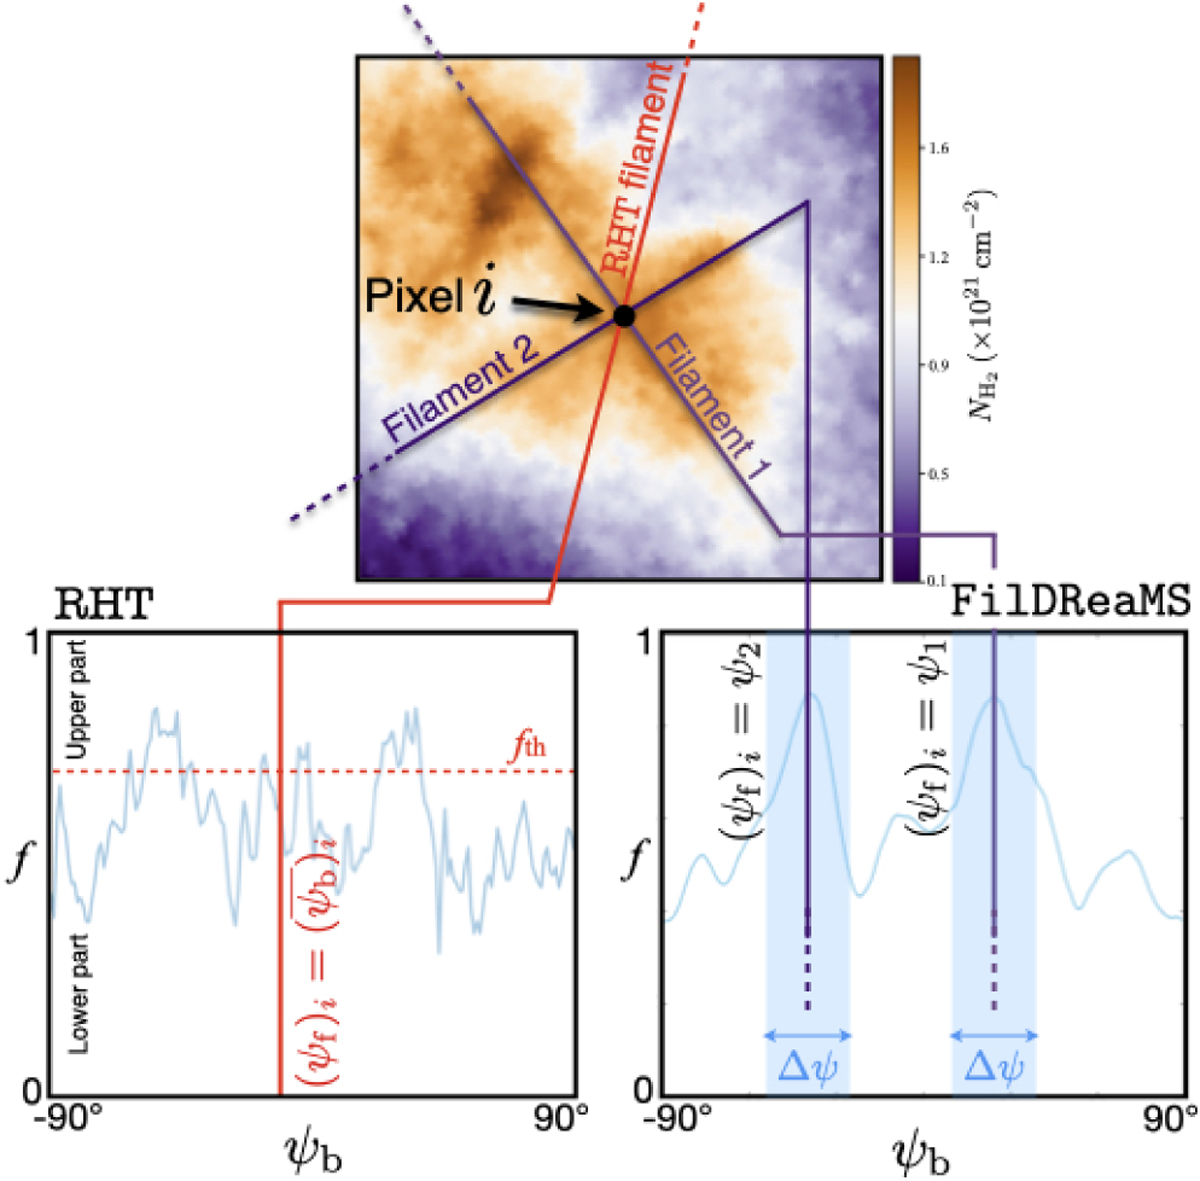
Illustration of a case where the considered pixel i lies at the intersection of two filaments with different orientations. Top: subregion of the initial map A, highlighting the filaments detected with FilDReaMS (dark blue lines) and when computing expectation over RHT orientation function (red line). Bottom: orientation function obtained with RHT (left) and FilDReaMS (right), showing the filament orientation angles derived in both cases.
Current usage metrics show cumulative count of Article Views (full-text article views including HTML views, PDF and ePub downloads, according to the available data) and Abstracts Views on Vision4Press platform.
Data correspond to usage on the plateform after 2015. The current usage metrics is available 48-96 hours after online publication and is updated daily on week days.
Initial download of the metrics may take a while.


