Fig. 11
Download original image
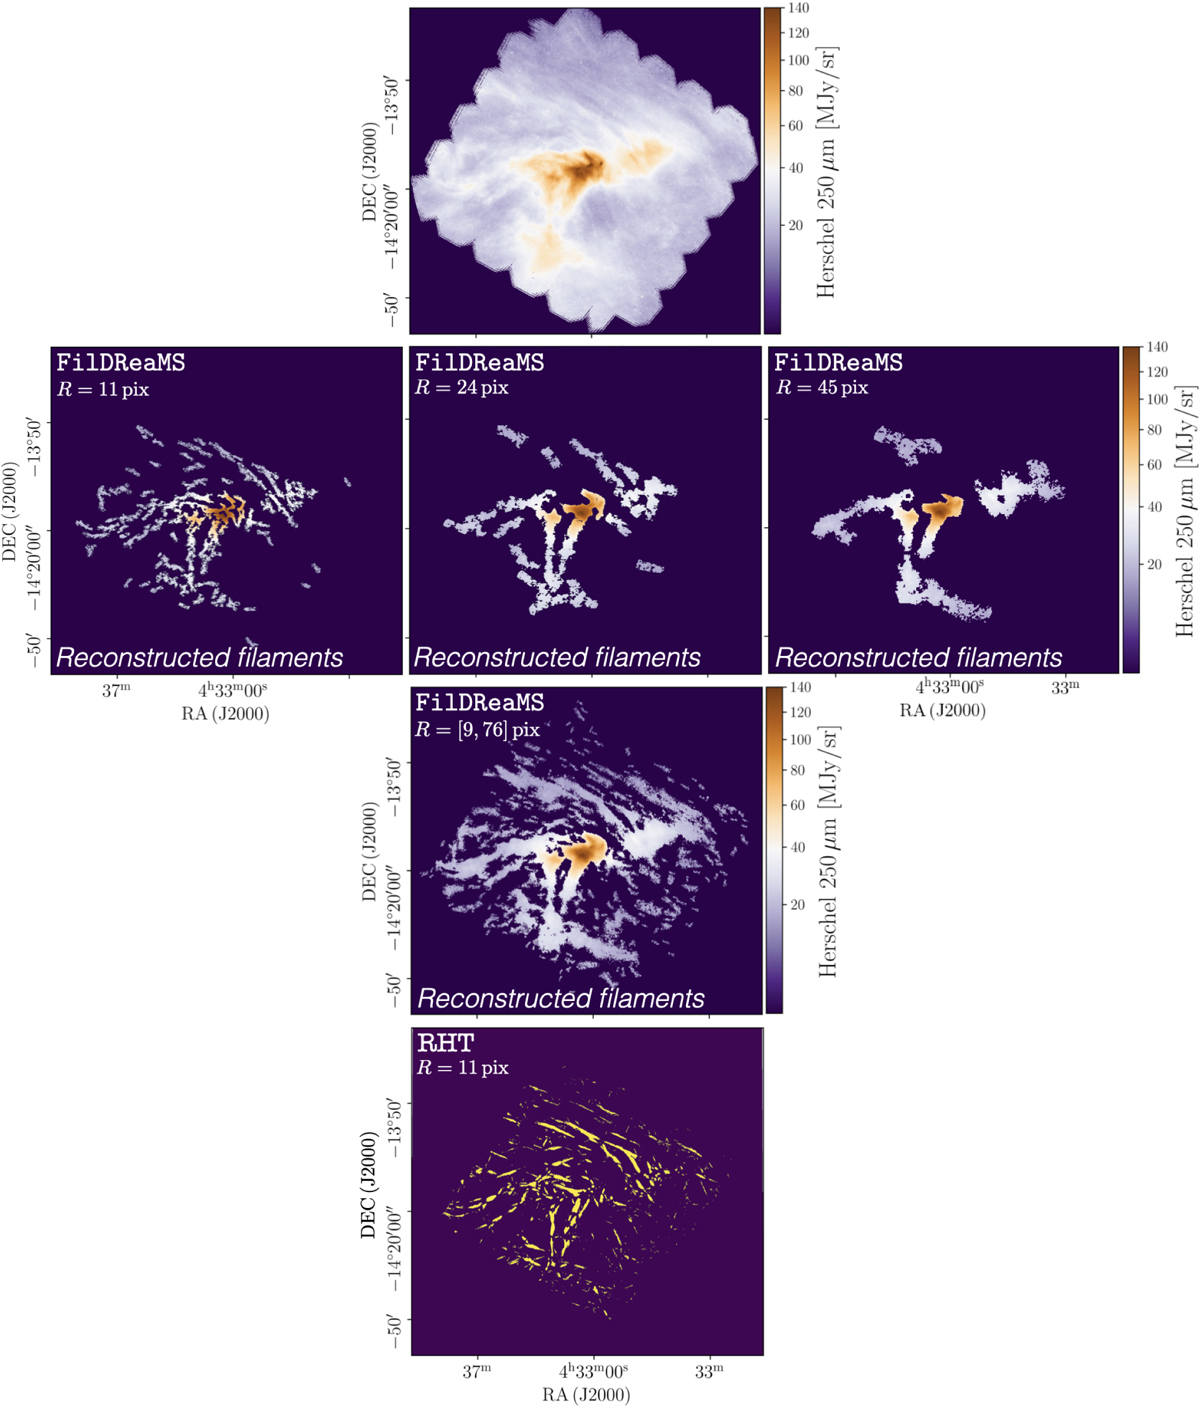
Application of FilDReaMS to the 250 μm intensity map of the Herschel G210 field. Top row: 250 μm intensity map of G210. Second row: reconstructed filaments with bar widths Wb = 6px (left), Wb = 10 px (middle), and Wb = 17 px (right). Third row: map of all the reconstructed filaments with bar width in the range [5,27] px. Bottom row: filaments detected with RHT using a 2D top-hat radius R = 11 px (Malinen et al. 2016). The color code of the reconstructed filaments indicates their column density ![]() .
.
Current usage metrics show cumulative count of Article Views (full-text article views including HTML views, PDF and ePub downloads, according to the available data) and Abstracts Views on Vision4Press platform.
Data correspond to usage on the plateform after 2015. The current usage metrics is available 48-96 hours after online publication and is updated daily on week days.
Initial download of the metrics may take a while.