Fig. 1
Download original image
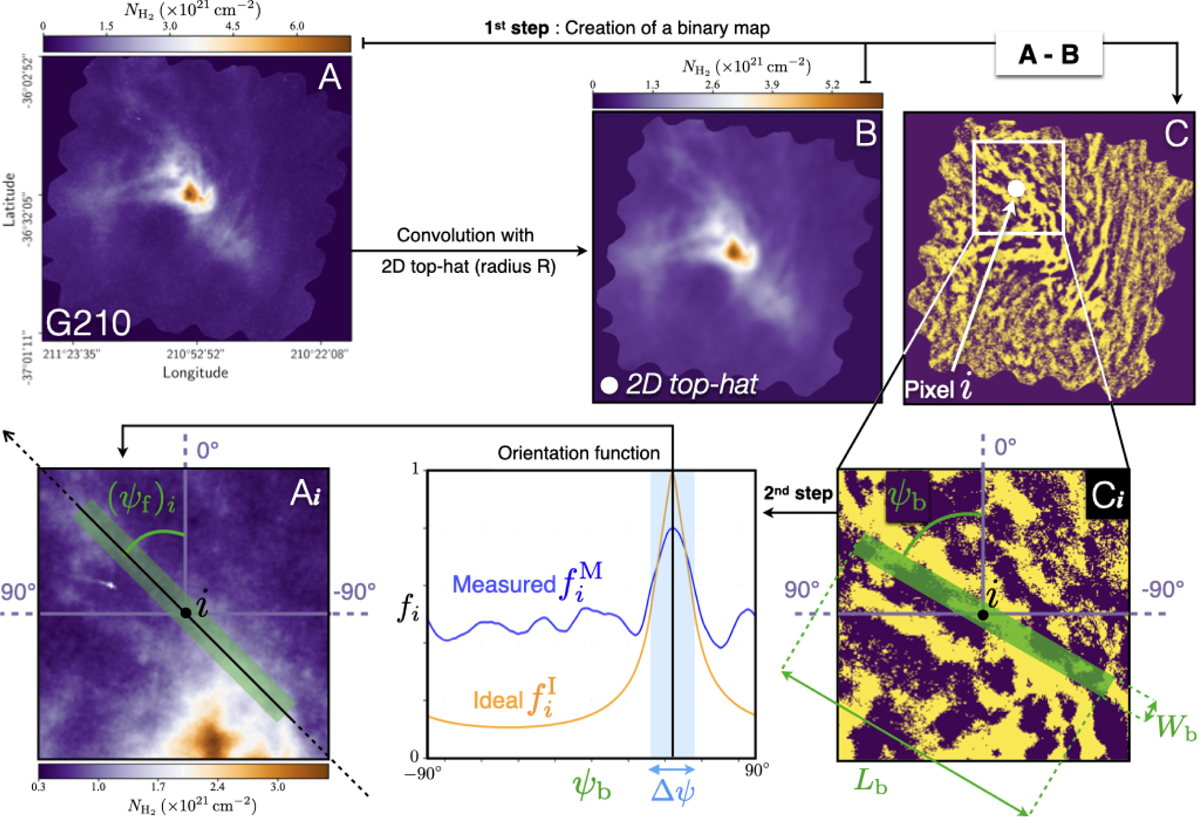
Illustration of the FilDReaMS method applied to one pixel i of the H2 column density map of the Herschel G210 field. Top left: initial map A of the entire G210 field. Top middle: smoothed map B obtained by convolving map A with a 2D top-hat kernel. Top right: corresponding binary map C in which the yellow pixels have a value of 1 and the dark pixels a value of 0. Bottom right: subregion Ci of map C centered on pixel i, with the model bar (width Wb, length Lb, and orientation angle ψb) overplotted in green. Bottom middle: measured orientation function, equal to the fraction of the bar area covered by yellow pixels, ![]() , as a function of ψb, (blue curve). Also shown are the ideal orientation function,
, as a function of ψb, (blue curve). Also shown are the ideal orientation function, ![]() (orange curve; see Sect. 3.4) and the angular window of width ∆ψ (Eq. (1)). Bottom left: subregion Ai of map A centered on pixel i, with the model bar overplotted in green at the orientation angle (ψf)i of a potential filament (corresponding to the peak of
(orange curve; see Sect. 3.4) and the angular window of width ∆ψ (Eq. (1)). Bottom left: subregion Ai of map A centered on pixel i, with the model bar overplotted in green at the orientation angle (ψf)i of a potential filament (corresponding to the peak of ![]() ).
).
Current usage metrics show cumulative count of Article Views (full-text article views including HTML views, PDF and ePub downloads, according to the available data) and Abstracts Views on Vision4Press platform.
Data correspond to usage on the plateform after 2015. The current usage metrics is available 48-96 hours after online publication and is updated daily on week days.
Initial download of the metrics may take a while.