Fig. 9
Download original image
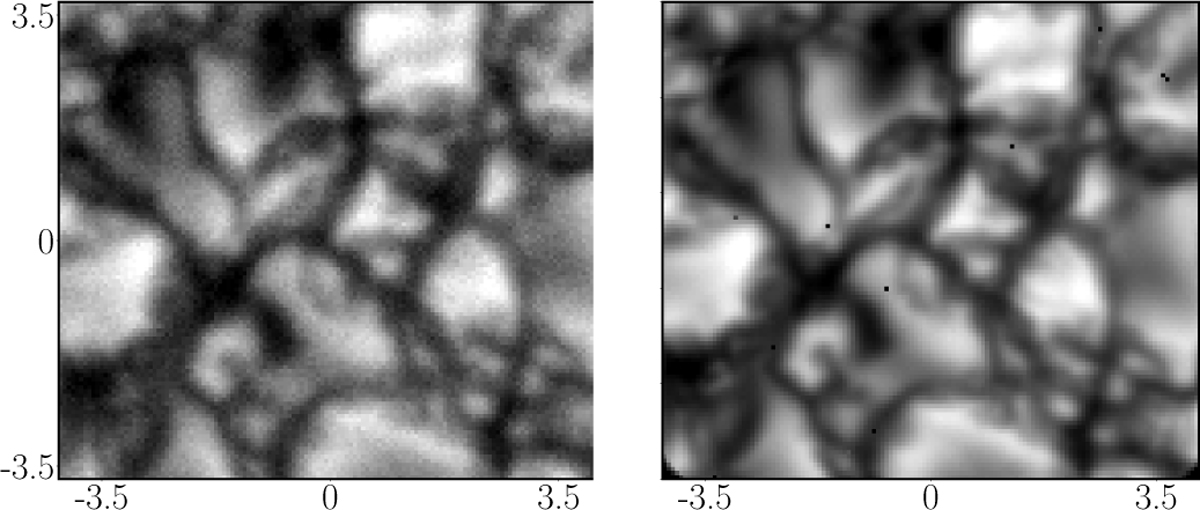
Raw images from 10 July 2017 for a selected part of the FOV. Left: average over three context images. Right: wavelength-integrated hyperspectral data, simultaneously recorded with the average over the context images. The horizontal and vertical scales are in arcseconds. Black pixels indicate either image elements for which the transmission is very low or image elements that are vignetted over a significant part of the spectral range.
Current usage metrics show cumulative count of Article Views (full-text article views including HTML views, PDF and ePub downloads, according to the available data) and Abstracts Views on Vision4Press platform.
Data correspond to usage on the plateform after 2015. The current usage metrics is available 48-96 hours after online publication and is updated daily on week days.
Initial download of the metrics may take a while.