Open Access
Fig. 4
Download original image
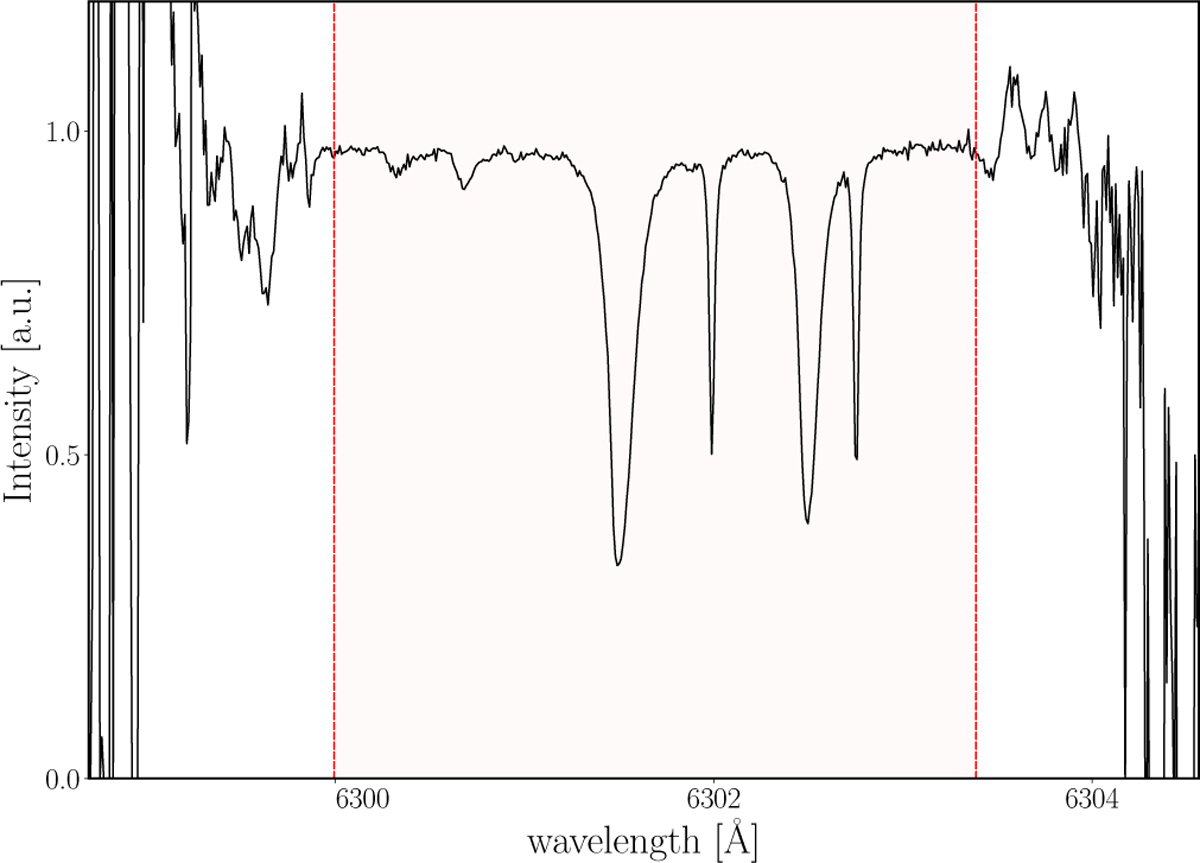
Raw extracted spectrum of pixel (x,y) = (85,75), averaged over a 10s period. The red lines are the wavelengths at which the filter has half of the peak transmission; outside of this range the contamination of the spectra from the rows above and below this row significantly contaminate this spectrum.
Current usage metrics show cumulative count of Article Views (full-text article views including HTML views, PDF and ePub downloads, according to the available data) and Abstracts Views on Vision4Press platform.
Data correspond to usage on the plateform after 2015. The current usage metrics is available 48-96 hours after online publication and is updated daily on week days.
Initial download of the metrics may take a while.