Fig. 15
Download original image
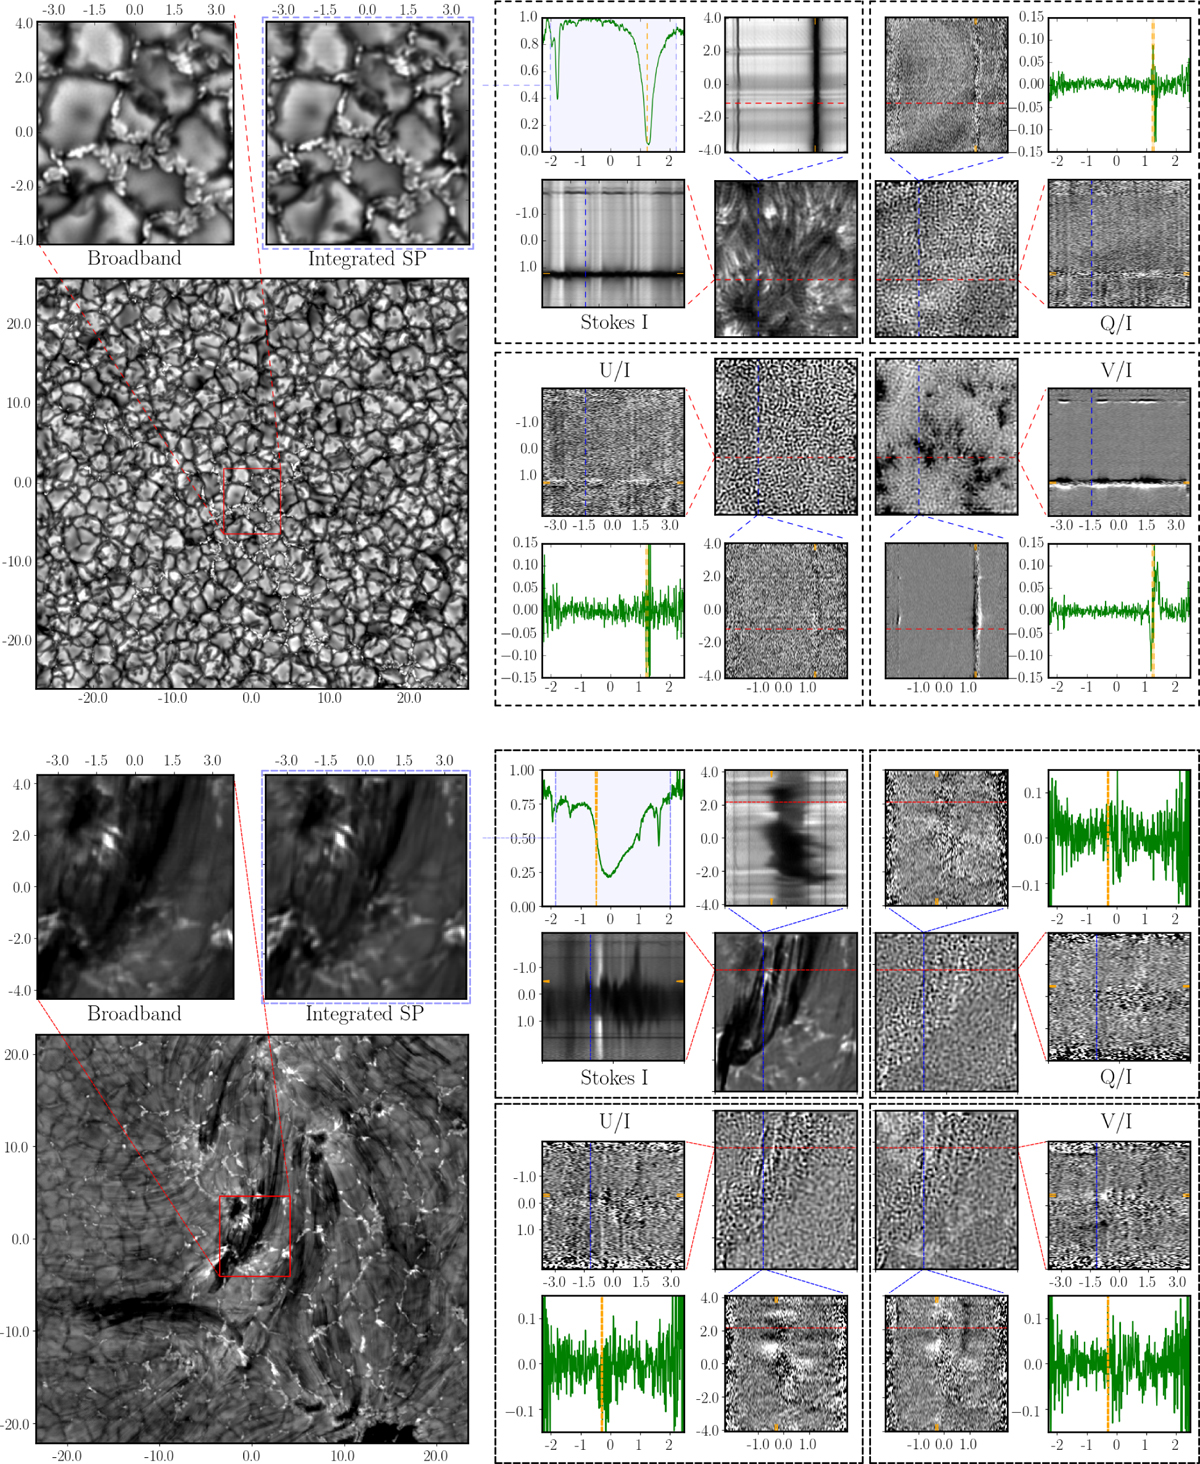
Examples of restored chromospheric data. Top panel: network near disk center in the spectral band 5893.5–5897.5 Å, which contains a Na-D line at 5896 Å and a Ni/Fe line pair around 5893 Å. Bottom panel: active region loop in a newly emerging active region near diskcenter, in the spectral band 6561–6565 Å, which contains the H-α line at 6562.8 Å. All spatial scales are in arcseconds, and all wavelength scales are in Å.
Current usage metrics show cumulative count of Article Views (full-text article views including HTML views, PDF and ePub downloads, according to the available data) and Abstracts Views on Vision4Press platform.
Data correspond to usage on the plateform after 2015. The current usage metrics is available 48-96 hours after online publication and is updated daily on week days.
Initial download of the metrics may take a while.